
Choose your location
Australia
English
Belgium
Denmark
Estonia
Finland
France
Iceland
Ireland
Latvia
Lithuania
Luxembourg
Netherlands
Norway
Portugal
Sweden
United Kingdom
 2024 Global Market Outlook Midyear Update
How central bank policy could impact your portfolio
At midyear, expectations for rate cuts have been pushed out further, with far fewer anticipated, and markets have repriced accordingly. We anticipate growth in the global economy. We see continued market broadening, with select equity and fixed income opportunities. Most importantly, the ongoing transition from the low-rate post-GFC environment to one characterised by higher interest rates may provide favorable conditions for active managers to outperform.
Video Player is loading.
Transcript
As we head into the second half of 2024, we’re in a different market environment than expected, with a rate environment that has shifted toward “higher for longer.” Expectations for rate cuts have been pushed out further, with far fewer anticipated, and markets have repriced accordingly.
Most developed market central banks face a delicate balance between cutting too soon and fuelling an acceleration in inflation or keeping rates higher for longer and causing a slowdown. In the United States, we expect the Fed will keep rates steady for longer in order to bring inflation sustainably lower. In other regions, including the UK and Europe, the path is clearer for cuts before year-end. We expect Japan will gradually continue tightening too.
Monetary policy will have investment implications for investors, as we move from recession risk to inflation risk. Sticky inflation remains a threat and could inflect higher as global growth broadens. Election cycles also put upward pressure on inflation, and we’re mindful of an escalation in geopolitical issues. We have overweight positions in real assets and inflation protected government debt as an inflation hedge.
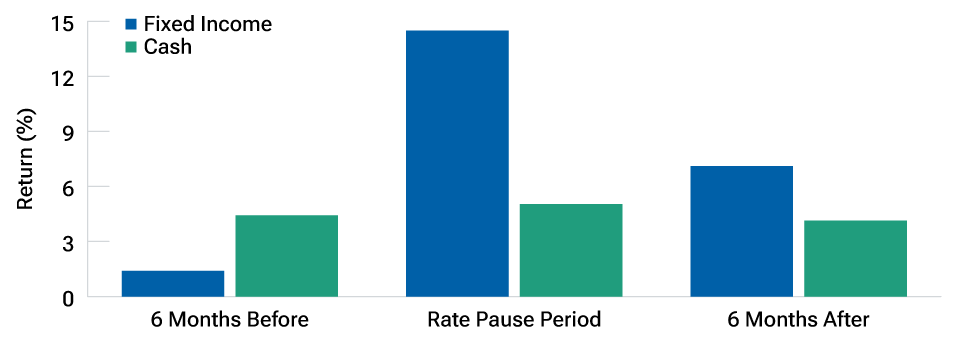
Within fixed income, we have a preference for short duration bonds. And while credit spreads are tight, all-in yields look attractive, with the potential for price appreciation if yields move lower—we are overweight high yield and emerging market debt.
The Magnificent Seven tech stocks drove the bulk of gains in 2023. We believe generative AI will create long-term winners, but stock selection will be key, as performance of the group continues to fragment. Furthermore, its impact on power and the industrial complex is creating opportunities for investors.
We anticipate a continued broadening of markets and think it is prudent for investors to diversify into areas that have valuation support and robust fundamentals, such as value stocks. More broadly, we continue to favour Japan and see select opportunities in emerging markets such as South Korea and Vietnam.
An active approach is key to navigating these shifting market conditions.
Important Information
This material is being furnished for general informational and/or marketing purposes only. The material does not constitute or undertake to give advice of any nature, including fiduciary investment advice, nor is it intended to serve as the primary basis for an investment decision. Prospective investors are recommended to seek independent legal, financial and tax advice before making any investment decision. T. Rowe Price group of companies including T. Rowe Price Associates, Inc. and/or its affiliates receive revenue from T. Rowe Price investment products and services. Past performance is not a reliable indicator of future performance. The value of an investment and any income from it can go down as well as up. Investors may get back less than the amount invested.
The material does not constitute a distribution, an offer, an invitation, a personal or general recommendation or solicitation to sell or buy any securities in any jurisdiction or to conduct any particular investment activity. The material has not been reviewed by any regulatory authority in any jurisdiction.
The views contained herein are those of the Global Market Outlook authors as of June 2024 and are subject to change without notice; these views may differ from those of other T. Rowe Price associates.
Information and opinions presented have been obtained or derived from sources believed to be reliable and current; however, we cannot guarantee the sources' accuracy or completeness. There is no guarantee that any forecasts made will come to pass. Under no circumstances should the material, in whole or in part, be copied or redistributed without consent from T. Rowe Price.
The material is not intended for use by persons in jurisdictions which prohibit or restrict the distribution of the material and in certain countries the material is provided upon specific request.
It is not intended for distribution to retail investors in any jurisdiction.
The specific securities identified and described are for illustrative purposes only and do not represent all of the securities purchased, sold, or recommended by T. Rowe Price, and no assumptions should be made that investments in the securities identified and discussed were or will be profitable.
Australia –Issued by T. Rowe Price Australia Limited (ABN: 13 620 668 895 and AFSL: 503741), Level 28, Governor Phillip Tower, 1 Farrer Place, Sydney NSW 2000, Australia. For Wholesale Clients only.
Brunei –This material can only be delivered to certain specific institutional investors for informational purpose only. Any strategy and/or any products associated with the strategy discussed herein has not been authorised for distribution in Brunei. No distribution of this material to any member of the public in Brunei is permitted.
Mainland China –This material is provided to qualified investors only. No invitation to offer, or offer for, or sale of, the shares will be made in the mainland of the People’s Republic of China (“Mainland China”, not including the Hong Kong or Macau Special Administrative Regions or Taiwan) or by any means that would be deemed public under the laws of the Mainland China. The information relating to the strategy contained in this material has not been submitted to or approved by the China Securities Regulatory Commission or any other relevant governmental authority in the Mainland China. The strategy and/or any product associated with the strategy may only be offered or sold to investors in the Mainland China that are expressly authorized under the laws and regulations of the Mainland China to buy and sell securities denominated in a currency other than the Renminbi (or RMB), which is the official currency of the Mainland China. Potential investors who are resident in the Mainland China are responsible for obtaining the required approvals from all relevant government authorities in the Mainland China, including, but not limited to, the State Administration of Foreign Exchange, before purchasing the shares. This document further does not constitute any securities or investment advice to citizens of the Mainland China, or nationals with permanent residence in the Mainland China, or to any corporation, partnership, or other entity incorporated or established in the Mainland China.
Hong Kong –Issued by T. Rowe Price Hong Kong Limited, 6/F, Chater House, 8 Connaught Road Central, Hong Kong. T. Rowe Price Hong Kong Limited is licensed and regulated by the Securities & Futures Commission. For Professional Investors only.
Indonesia – This material is intended to be used only by the designated recipient to whom T. Rowe Price delivered; it is for institutional use only. Under no circumstances should the material, in whole or in part, be copied, redistributed or shared, in any medium, without prior written consent from T. Rowe Price. No distribution of this material to members of the public in any jurisdiction is permitted.
Korea – This material is intended only to Qualified Professional Investors. Not for further distribution.
Malaysia – This material can only be delivered to specific institutional investor. This material is solely for institutional use and for informational purposes only. This material does not provide investment advice or an offering to make, or an inducement or attempted inducement of any person to enter into or to offer to enter into, an agreement for or with a view to acquiring, disposing of, subscribing for or underwriting securities. Nothing in this material shall be considered a making available of, solicitation to buy, an offering for subscription or purchase or an invitation to subscribe for or purchase any securities, or any other product or service, to any person in any jurisdiction where such offer, solicitation, purchase or sale would be unlawful under the laws of Malaysia.
New Zealand – Issued by T. Rowe Price Australia Limited (ABN: 13 620 668 895 and AFSL: 503741), Level 28, Governor Phillip Tower, 1 Farrer Place, Sydney NSW 2000, Australia. No Interests are offered to the public. Accordingly, the Interests may not, directly or indirectly, be offered, sold or delivered in New Zealand, nor may any offering document or advertisement in relation to any offer of the Interests be distributed in New Zealand, other than in circumstances where there is no contravention of the Financial Markets Conduct Act 2013.
Philippines –ANY STRATEGY AND/ OR ANY SECURITIES ASSOCIATED WITH THE STRATEGY BEING DISCUSSED HEREIN HAVE NOT BEEN REGISTERED WITH THE SECURITIES AND EXCHANGE COMMISSION UNDER THE SECURITIES REGULATION CODE. ANY FUTURE OFFER OR SALE OF THE STRATEGY AND/ OR ANY SECURITIES IS SUBJECT TO REGISTRATION REQUIREMENTS UNDER THE CODE, UNLESS SUCH OFFER OR SALE QUALIFIES AS AN EXEMPT TRANSACTION.
Singapore – Issued by T. Rowe Price Singapore Private Ltd. (UEN: 201021137E), 501 Orchard Rd, #10-02 Wheelock Place, Singapore 238880. T. Rowe Price Singapore Private Ltd. is licensed and regulated by the Monetary Authority of Singapore. For Institutional and Accredited Investors only.
Taiwan – This does not provide investment advice or recommendations. Nothing in this material shall be considered a solicitation to buy, or an offer to sell, a security, or any other product or service, to any person in the Republic of China.
Thailand –This material has not been and will not be filed with or approved by the Securities Exchange Commission of Thailand or any other regulatory authority in Thailand. The material is provided solely to “institutional investors” as defined under relevant Thai laws and regulations. No distribution of this material to any member of the public in Thailand is permitted. Nothing in this material shall be considered a provision of service, or a solicitation to buy, or an offer to sell, a security, or any other product or service, to any person where such provision, offer, solicitation, purchase or sale would be unlawful under relevant Thai laws and regulations.
© 2024 T. Rowe Price. All Rights Reserved. T. ROWE PRICE, INVEST WITH CONFIDENCE, and the Bighorn Sheep design are, collectively and/ or apart, trademarks of T. Rowe Price Group, Inc.
Video
A 2-minute summary with Ritu Vohora
T. Rowe Price’s Investment Specialist of Capital Markets, Ritu Vohora provides a summary of the key themes covered in the 2024 Global Market Outlook Midyear Update webinar.
Key factors shaping our midyear market outlook
Interest rates
Higher for longer has become the consensus
Higher for longer has become the consensus
Most developed market central banks are walking a tightrope amid reaccelerating inflation. Our view is that the U.S. Federal Reserve (Fed) is likely to make fewer cuts, while we believe the European Central Bank will cut between 1–3 times. We expect Japan to gradually tighten its monetary policy.
Key takeaway
The Fed is more likely to surprise with fewer cuts than with more.


Infographic
Something to share with your clients
Our infographic provides a high-level summary of our midyear update. Key takeaways are illustrated in a client-friendly format, making it ideal for sharing with clients in print
or via email.
Video Player is loading.
Webinar Replay
2024 Global Market Outlook Midyear Update
Hosted by Ritu Vohora, hear what’s shaping our markets from T. Rowe Price’s thought leaders: Sebastien Page, Head of Global Multi-Asset and Chief Investment Officer; Kenneth Orchard, Head of International Fixed Income and Portfolio Manager; Peter Bates, Portfolio Manager, Global Concentrated Strategy, and Blerina Uruci, Chief U.S. Economist.
Additional insights


202406-3644999