May 2024 / MULTI-ASSET
The hottest debate in asset allocation: Value vs. growth stocks
Macro, fundamental, and sentiment catalysts support the valuation case.
On the Asset Allocation Committee, we like value stocks as a tactical trade for the next six to 12 months. Macro, fundamental, and sentiment catalysts support the valuation case.
But first, how is “value” defined?
An easy way to distinguish between value and growth stocks is to rank them by their book‑to-market (B/M) ratio.
I like to think of the B/M ratio as a yardstick for the level of disagreement between accountants and money managers about a company’s value.
Book value (B) is what accountants think the company is worth—the difference between the company’s assets and liabilities.
Market value (M) is the market capitalization (shares outstanding multiplied by price). It’s what investors think the company is worth based on its future earnings prospects.
Theoretically, companies with a high B/M ratio are “cheap,” and those with a low B/M are “expensive.”
Of course, it’s not that simple.
Valuing a company is difficult. It requires forecasting future earnings and putting a price on risk.
On the one side, accountants use rules. They try to avoid making messy judgment calls. These rules are necessary to make financial statements comparable across companies, but they often fail to capture future earnings growth. Despite efforts to measure “intangibles,” accountants don’t have the tools to value a fast-growing company’s ability to gain market share. There’s too much judgment involved.
On the other side, it’s an investor’s job to make judgment calls. We don’t care whether our forecasts are comparable with other investors. You don’t want two accountants to disagree on a company’s earnings or book value, but it’s expected that money managers will disagree on a company’s market value. A stock’s price reflects a collection of independent judgments.
Where’s the value premium?
Over time, who’s been right more often? Accountants or money managers?
There’s evidence that money managers should pay more attention to book values. Between 1926 and 2023, stocks with high B/M ratios have outperformed those with low B/M ratios by an average of 4.2%.1 We call this the value premium. Academic careers have been built on discovering and explaining it, and money management careers have been built on harvesting it.
Academics explain this premium as compensation for risk. Value stocks are more cyclical; hence, investors should require a premium to invest in them.2 Some money managers prefer to explain it as an anomaly caused by irrational investor behavior. They posit that value stocks have historically outperformed over time because they’re boring. I’m paraphrasing, but the idea is that investors tend to overpay for “glamour,” high-growth, and high-momentum stocks.3
Unfortunately for the value zealots, the value premium has weakened. Over the last 20 years, the average value premium was -1.4%.4 Yep, it was negative. Growth stocks outperformed despite their low B/M ratio.
Two decades seems like a long enough time to question the effectiveness of B/M as a measure of “value.” And before you ask, another measure of value, earnings yield (E/P), hasn’t performed better.5
Since the 2008 great financial crisis, the Russell 1000 Growth Index has outperformed its value counterpart by over 114%, as shown in the chart below.
Russell 1000 Growth minus Russell 1000 Value
(Fig. 1) Cumulative relative return

Past performance is not a reliable indicator of future performance.
Source: FTSE/Russell. Analysis by T. Rowe Price. Monthly data from January 2009 to March 2024.
However, unlike during the internet bubble, earnings have supported growth stocks’ outperformance. It’s not just a valuation sugar high—fundamental proteins have also fueled this rally. The chart below zooms out to 1995 and shows that when we adjust for earnings, growth stocks are expensive relative to value stocks, but the earnings yield (E/P) spread is nowhere near the cumulative price appreciation spread.
Relative forward 12-month earnings yield
(Fig. 2) Russell 1000 Value/Russell 1000 Growth
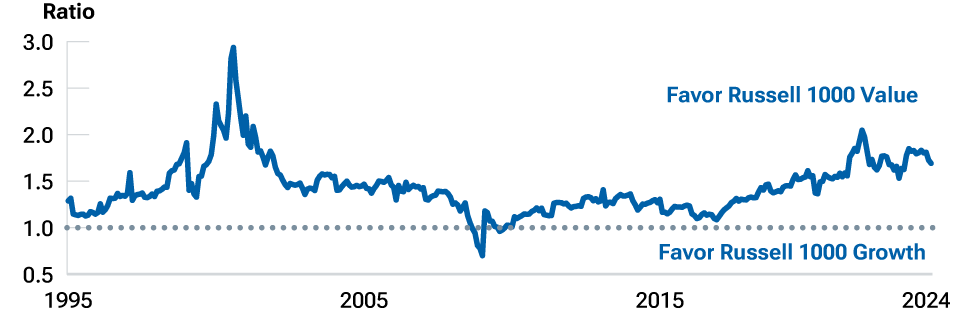
These statistics are not a projection of future results. Actual results may vary.
Source: FTSE/Russell. Analysis by T. Rowe Price. Monthly data from January 1995 to March 2024.
Still, the valuation signal favors value. Historically, when value was as cheap as it is currently relative to growth, it outperformed growth over the following 12 months by 5.8% to 7.0% on average, as shown below. This signal was in the same ZIP code, and the value trade was very profitable around the internet bubble and in 2021, when stimulus money was juicing the rally that preceded the interest rate shock of 2022.
12-month forward returns of value vs. growth based on E/P difference quintiles
(Fig. 3) Using rolling 10-year windows to calibrate quintiles, monthly data from January 1990 to March 2024.
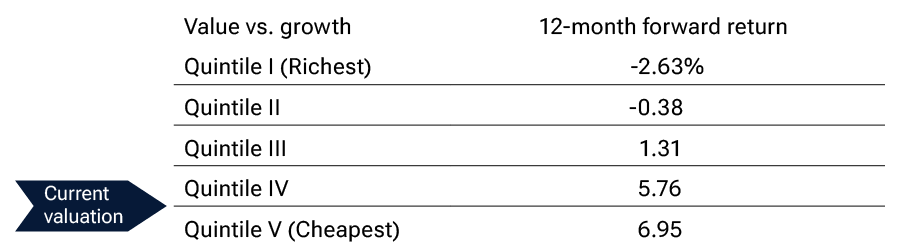
Past performance is not a reliable indicator of future performance. These statistics are not a projection of future results.
Source: FTSE/Russell. Analysis by T. Rowe Price. Monthly data from January 1995 to March 2024.
Valuation signals often fail when there’s no catalyst for the rotation. Now, there are three potential catalysts for value to outperform. They speak to our broader framework for tactical asset allocation, which, in addition to relative valuations, also focuses on fundamentals, macro, and sentiment:
(1) Fundamentals: With rising commodity prices, signs of a cyclical upswing the (manufacturing Purchasing Managers’ Index inflected above 50 in March 2024), increased optimism from industrials CEOs, and easy year-over-year comparisons, value stocks could see an acceleration in earnings. Figure 4 indicates that analysts expect a textbook rotation in fundamentals with value taking the baton from growth.
Estimated (consensus) year-over-year EPS growth
(Fig. 4) Russell 1000 Value vs. Russell 1000 Growth
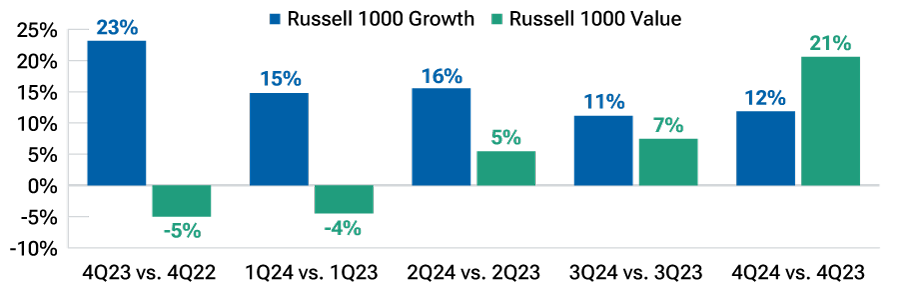
Actual outcomes may differ materially from estimates.
Source: FTSE/Russell. Analysis by T. Rowe Price. EPS expectations for 2Q24 and beyond are based on estimates as of 4/9/24. For previous quarters, the realized year-over-year EPS growth is reported.
(2) Macro: On the margin, macro factors favor value. Recently, I asked 26 analysts and portfolio managers from our Multi-Asset Strategy team to vote on macro scenarios—on growth, inflation, fed funds, oil prices, and the tech valuation premium—and their potential impact on the value versus growth trade over the next 12 months. We asked them to express their views relative to market expectations.
The team believes the strongest macro factor favoring value could be rising oil prices (energy stocks have a higher representation in the value universe), followed by higher‑than-expected fed funds and inflation.
When asked whether oil prices were headed higher, lower, or staying the “same” relative to current market expectations (based on forward prices), 65% responded higher, 35% responded same, and 0% responded lower.
Consistent with this view, outside of the Multi-Asset Division, several stock analysts and portfolio managers on our platforms are overweight energy stocks.
(3) Sentiment: Value has been unloved. Flows into growth relative to value products are in their 92nd percentiles over the last year—in other words, investors have been more enthusiastic about growth only 8% of the time. The growth trade feels crowded. This could favor value if one or more of the other factors (valuation, fundamentals, macro) kick in, motivating investors to rotate.
(Fig. 5) Combining valuation and momentum for value vs. growth
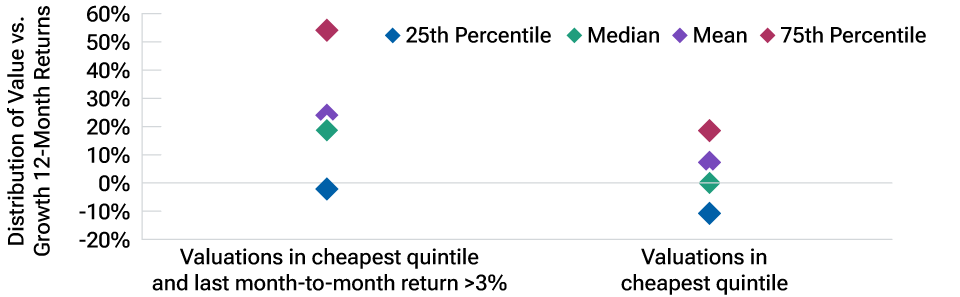
Past performance is not a reliable indicator of future performance.
Source: FTSE/Russell. Analysis by T. Rowe Price. Monthly data from January 1990 to March 2024.
Valuations quintiles are computed in terms of the earnings yield difference between the Russell 1000 Value Index and the Russell 1000 Growth Index, on a trailing 120-month horizon.
Also, there are signs that value has gathered momentum, at least over the short term. The Russell 1000 Value Index outperformed its growth counterpart by 3.2% in March. As the chart below suggests, short-term momentum is often a sign that catalysts are beginning to emerge.
A study titled “Value and Momentum Everywhere” (2013) by Cliff Asness, Toby Moskowitz, and Lasse Heje Pedersen supports this idea of combining value and momentum. The authors applied these signals across markets (individual U.S., UK, Europe, and Japan stocks; equity country indexes; currencies; global government bonds; and commodity futures). They obtained a stratospheric—hardly ever seen in practice—Sharpe (return‑to‑risk) ratio of 1.59.
Caveats
We’re buying value in two ways: by rebalancing to target as growth rallies and by moving the target higher. But we’re doing this incrementally. Why aren’t we moving faster?
The main caveats are the following:
- Large growth stocks remain formidable cash flow machines—we believe they’re long‑term winners.
- In a flight to safety, it’s possible that growth stocks would outperform because they’re less cyclical.
We believe that artificial intelligence will continue to motivate capital spending on technology and create efficiency gains.
Active security selection helps mitigate these risks. Across our value and growth strategies, our stock pickers, on average, favor the tech sector. This illustrates one of the advantages of active investing over using index funds: We can overweight value without taking a large bet against the tech sector at the total portfolio level.
Notes
Thank you to Cesare Buiatti for running the numbers on most of the exhibits in this note and to Charles Shriver, Dave Eiswert, Rob Panariello, Grace Zheng, Sean Jones, Megumi Chen, Tim Murray, Josh Yocum, and Viraj Vora for their valuable contributions.
A note on methodologies: The premiums of 4.2% and -1.4% are from Ken French’s data library. The figure 4.2% is the arithmetic average of annual (calendar) “HML” (High Minus Low B/M) factor returns between 1927 and 2023, and -1.4% is the average for the last 20 years (2004–2023).
The rest of the analysis is based on the Russell 1000 Growth and Value indexes. Russell uses three factors to rank stocks along the value-growth spectrum, using the following weightings:
- B/M (50%)
- Two-year expected earnings per share growth from I/B/E/S (25%)
- Five-year trailing sales per share growth (25%)
Of note, 30% of the Russell 1000 universe is included in both the Russell Growth and Value indexes.
Additional Disclosure
London Stock Exchange Group plc and its group undertakings (collectively, the “LSE Group”). © LSE Group 2024. “FTSE®” “Russell®”, and “FTSE Russell®” are trade mark(s) of the relevant LSE Group companies and are used by any other LSE Group company under license. All rights in the FTSE Russell indexes or data vest in the relevant LSE Group company which owns the index or the data. Neither LSE Group nor its licensors accept any liability for any errors or omissions in the indexes or data and no party may rely on any indexes or data contained in this communication. No further distribution of data from the LSE Group is permitted without the relevant LSE Group company’s express written consent. The LSE Group does not promote, sponsor or endorse the content of this communication. The LSE Group is not responsible for the formatting or configuration of this material or for any inaccuracy in T. Rowe Price’s presentation thereof.
IMPORTANT INFORMATION
This material is being furnished for general informational and/or marketing purposes only. The material does not constitute or undertake to give advice of any nature, including fiduciary investment advice, nor is it intended to serve as the primary basis for an investment decision. Prospective investors are recommended to seek independent legal, financial and tax advice before making any investment decision. T. Rowe Price group of companies including T. Rowe Price Associates, Inc. and/or its affiliates receive revenue from T. Rowe Price investment products and services. Past performance is not a reliable indicator of future performance. The value of an investment and any income from it can go down as well as up. Investors may get back less than the amount invested.
The material does not constitute a distribution, an offer, an invitation, a personal or general recommendation or solicitation to sell or buy any securities in any jurisdiction or to conduct any particular investment activity. The material has not been reviewed by any regulatory authority in any jurisdiction.
Information and opinions presented have been obtained or derived from sources believed to be reliable and current; however, we cannot guarantee the sources' accuracy or completeness. There is no guarantee that any forecasts made will come to pass. The views contained herein are as of the date noted on the material and are subject to change without notice; these views may differ from those of other T. Rowe Price group companies and/or associates. Under no circumstances should the material, in whole or in part, be copied or redistributed without consent from T. Rowe Price.
The material is not intended for use by persons in jurisdictions which prohibit or restrict the distribution of the material and in certain countries the material is provided upon specific request.
It is not intended for distribution to retail investors in any jurisdiction.

Sébastien Page is head of Global Multi-Asset and chief investment officer. He is a member of the Asset Allocation Committee, which is responsible for tactical investment decisions across asset allocation portfolios. Sébastien also is a member of the Management Committee of T. Rowe Price Group, Inc.