
July 2024 / MULTI-ASSET
Could the Volatility Index (VIX) be broken?
The VIX has recently displayed a more subdued reaction to market sell-offs than expected. Could it be broken?
Key Insights
- The VIX has recently remained at lower levels, with a more subdued reaction to market sell‑offs than expected, raising the question: Could the VIX be broken?
- Two trends in the option markets have been pushing down the level of the VIX by decreasing the price of options included in pricing the index.
- We believe that the VIX is not broken, but its character has changed to reflect recent trends in the ways options are used, making it “less fear and more cheer” than it used to be.
The Chicago Board Options Exchange’s (CBOE) Volatility Index (VIX) is a financial benchmark designed to be a real‑time market estimate of the expected volatility of the S&P 500 Index. The VIX measures the implied volatility of options traded on the S&P 500. It is often cited as a gauge of fear in the marketplace. The level of the VIX and investors’ fear tend to move up when the stock market falls, and when the market rallies, the VIX as well as the level of fear tend to decline.
After remaining elevated for much of the post‑pandemic period, the VIX came down in 2023 and has since stayed at a fairly low level. More interestingly, it has had a lackluster reaction to recent sell‑offs caused by increased uncertainties around monetary policies and heightened geopolitical risks. This has led many investors to ask the question, “Could the VIX be broken?” In this paper, we attempt to address this question by looking at the methodology of the VIX, how recent dynamics in the option markets have affected the index, and how these dynamics could play out going forward.
The methodology for the VIX stems from a paper where the authors show how to theoretically replicate a variance swap using a basket of out‑of‑the‑money (OTM) options.1 The VIX aims to estimate the fair price of a one‑month variance swap on the S&P 500. The CBOE calculates and publishes the VIX figures based on this framework, using a large basket of sufficiently liquid listed options. The full calculation is a little involved but is essentially a weighted sum of the option prices. A few important notes to understand:
- Only options with between 23 and 37 days left to expiry are included in the calculation.
- Options that are closer to being at‑the‑money or that have a higher implied volatility will have a higher price and, therefore, a bigger impact on the VIX, all else equal.
- Options with a lower strike price will have a higher weight and a bigger impact on the VIX, all else equal.
To demonstrate the last two points visually, we model a volatility surface on the S&P 500 with a typical skew, where higher implied volatilities are expected for OTM puts, lower implied volatilities for at‑the‑money (ATM) options and slightly OTM calls, and higher implied volatilities for deep OTM calls. The contribution from options at different strikes is shown in Figure 1, where the VIX is the sum of all the bars.
Examining the contribution to the VIX from OTM calls and puts
(Fig. 1) OTM puts contribute a lot more than OTM calls
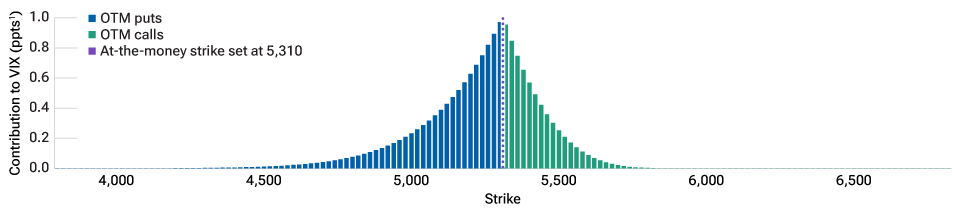
As of May 31, 2024.
1 Percentage points.
Source: Bloomberg Finance L.P. Analysis by T. Rowe Price.
Options that are close to being ATM contribute the most to the VIX. OTM puts (bars to the left of the vertical dashed line) contribute a lot more than OTM calls (bars to the right of the vertical dashed line). This is due to higher implied volatility and higher weighting of OTM puts as mentioned earlier.
With this context, we can now review some current trends in option markets, how they impact option prices across different strike ranges, and, consequently their impact on the price of the VIX.
1. The rise of zero days to expiration (0DTE) options
The first trend has been the rise of zero days to expiration (0DTE) options as shown in Figure 2. These became popular among retail investors shortly after the coronavirus pandemic and have since reached around 50% of daily volume across the S&P 500 option complex. Over the course of 2022 and 2023, many of the events that professional investors would have wished to hedge were related to economic data releases. These events tend to happen at a known time, meaning targeted protection can be bought on the day of the event using a 0DTE contract. Despite their typically high implied volatility, buying a few 0DTE options over a month is often cheaper than holding the equivalent one‑month option.
The CBOE introduced Tuesday‑ and Thursday‑expiring options on the S&P 500 in 2022, allowing for options to be bought and to expire every trading day of the week. This may have pushed some investors away from hedging with one‑month options and toward using 0DTEs instead. Indeed, as shown in Figure 2, notional volumes in one‑month puts remain at similar levels to those in 2018 and 2019, whereas 0DTE volumes have grown rapidly. This switch in hedging preference has decreased the demand for OTM puts included in the VIX calculation, which, as we established earlier, contribute significantly to the VIX price. Lower market demand means lower implied volatility and price, therefore a lower VIX.
The rise of zero days to expiration options is impacting VIX pricing
(Fig. 2) Option volumes in OTM 0DTE puts vs. puts captured by the VIX
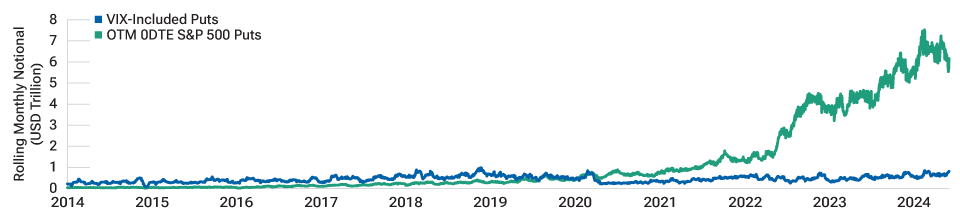
As of May 31, 2024.
Sources: OptionMetrics, Bloomberg Finance L.P.
Analysis by T. Rowe Price.
2. The rise of call‑overwriting exchange‑traded funds (ETFs)
The second trend is the rise of call‑overwriting ETFs. As shown in Figure 3, total assets of such ETFs have quadrupled over just two years. These are ETFs holding a long equity position (usually an index or close to an index), in addition to selling OTM calls on this index. The index and associated calls vary a little, with the majority going long the S&P 500 and selling calls with approximately one month to expiry. This has a direct impact on the OTM calls included in the VIX calculation, increasing their supply and thus decreasing their price, leading to a lower price level of the VIX.
Growth in option‑selling ETFs
(Fig. 3) Huge increase in supply is contributing to lower‑level VIX pricing
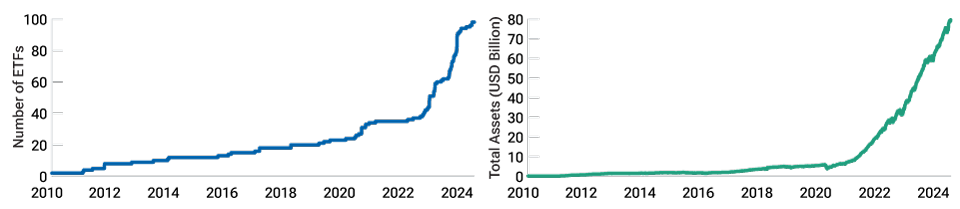
As of May 31, 2024.
Source: Bloomberg Finance L.P. Analysis by T. Rowe Price.
There is another more subtle consequence of these call‑overwriting ETFs. Buyers of these equity calls sold by ETFs tend to be market makers, who are not in the business of speculating but who aim to hedge out as much risk as possible. When they own a large number of call options, they will hedge market exposure by selling the underlying instrument. The amount that they must sell to fully hedge each option is measured by the option’s delta.
The option’s delta depends on a few things, but the main one is the difference between the price of the underlying and the option’s strike price. For call options, as the price of the underlying rises, the delta will also increase, and vice versa when the price of the underlying falls. If a market maker wants to remain hedged when the underlying moves, they must adjust their existing delta hedge. If the underlying price increases, they need to sell some of the underlying, and if the underlying price decreases, they need to buy back some of the underlying. How much the delta changes in correspondence to a move in the underlying price is known as the gamma. When market makers own a large number of options, they are long gamma.
To join the dots, call‑overwriting ETFs sell a considerable number of options to market makers, resulting in the market makers being long gamma. This means they are forced to buy into stock market sell‑offs and sell into market rallies. This suppresses market moves in either direction, decreases realized volatility, and ultimately supresses the VIX.
The above spells out how evolving market dynamics impact the VIX in theory. However, is there any empirical evidence suggesting that these trends have played a role, in practice, in subduing the level of the VIX?
Modeling the new VIX landscape
We use listed option data and approximately replicate the VIX methodology to calculate each individual option’s contribution to the VIX on a daily basis. We then, as shown in Figure 4, group these into different moneyness ranges corresponding to OTM puts (shown in blue), near‑the‑money options (shown in green), and OTM calls (shown in purple) and calculate each group’s contribution to the VIX.
The character of the VIX has changed in recent years
(Fig. 4) Contribution to the VIX from options with different moneyness ranges
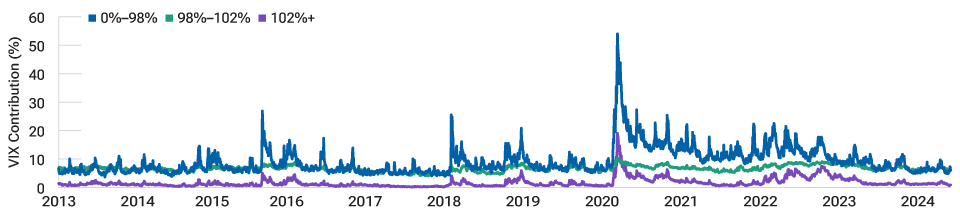
As of May 31, 2024.
Source: Bloomberg Finance L.P. Analysis by T. Rowe Price.
As shown below, the contribution to the VIX from OTM puts has been decreasing steadily since 2022 and has notably not been more than 10 points since October 2023, the longest streak since the period preceding the “Volmageddon” (the February 2018 spike in volatility). This evidence supports our theory that one‑month OTM puts are no longer investors’ instrument of choice for hedging.
The contribution from OTM calls has also decreased since 2022 but has settled at a higher level than prior to the pandemic. November 2021 to May 2024 saw a 638‑day streak of contributions of at least 0.85 points, by far the longest streak in our data. This contrasts with our theory that call‑overwriting ETFs are depressing OTM call prices, suggesting that some investors are willing to step in and buy these OTM calls at quite high prices relative to history.
So, could the VIX be broken?
To summarize, the VIX has a low contribution from OTM puts caused by a migration of one‑month hedges to the 0DTE space, and it has a high contribution from OTM calls despite the growth of call‑overwriting ETFs. In this respect, the VIX is not broken, but its character has changed somewhat to reflect recent trends in the ways options are used.
Going forward, if market catalysts continue to mostly be data releases, we expect 0DTE puts to remain popular hedges. We also see continued inflows into call‑overwriting ETFs given the still large premiums they offer. These continued inflows could eventually depress OTM call prices and push the VIX even lower, but as it stands, the VIX is less fear and more cheer than it used to be.
Important Information
This material is being furnished for general informational and/or marketing purposes only. The material does not constitute or undertake to give advice of any nature, including fiduciary investment advice. Prospective investors are recommended to seek independent legal, financial and tax advice before making any investment decision. T. Rowe Price group of companies including T. Rowe Price Associates, Inc. and/or its affiliates receive revenue from T. Rowe Price investment products and services. Past performance is not a reliable indicator of future performance. The value of an investment and any income from it can go down as well as up. Investors may get back less than the amount invested.
The material does not constitute a distribution, an offer, an invitation, a personal or general recommendation or solicitation to sell or buy any securities in any jurisdiction or to conduct any particular investment activity. The material has not been reviewed by any regulatory authority in any jurisdiction.
Information and opinions presented have been obtained or derived from sources believed to be reliable and current; however, we cannot guarantee the sources’ accuracy or completeness. There is no guarantee that any forecasts made will come to pass. The views contained herein are as of the date written and are subject to change without notice; these views may differ from those of other T. Rowe Price group companies and/or associates. Under no circumstances should the material, in whole or in part, be copied or redistributed without consent from T. Rowe Price.
The material is not intended for use by persons in jurisdictions which prohibit or restrict the distribution of the material and in certain countries the material is provided upon specific request. It is not intended for distribution to retail investors in any jurisdiction.
USA—Issued in the USA by T. Rowe Price Associates, Inc., 100 East Pratt Street, Baltimore, MD, 21202, which is regulated by the U.S. Securities and Exchange Commission. For Institutional Investors only.
© 2024 T. Rowe Price. All Rights Reserved. T. ROWE PRICE, INVEST WITH CONFIDENCE, and the Bighorn Sheep design are, collectively and/or apart, trademarks of T. Rowe Price Group, Inc.
