
Choose your location
United States
English
Austria
Belgium
Denmark
Estonia
Finland
France
Iceland
Ireland
Italy
Latvia
Lithuania
Luxembourg
Netherlands
Norway
Portugal
Spain
Sweden
Switzerland
United Kingdom
 Active Management Study
T. Rowe Price Strategies: More return. More often.
Our strategies beat their benchmarks more often – and at a higher level – than competitors.*
T. Rowe Price equity and fixed income strategies delivered higher average returns than their benchmarks 80% of the time. Plus, they beat their benchmark more frequently—and with better returns—than the average of all active managers. Dive into our active management composite study and learn more about how we achieved this.
See below for standardized returns and other information about the T. Rowe Price composites in this analysis.
Our study covers both equity and fixed income strategies. Learn more about the results of each asset class.
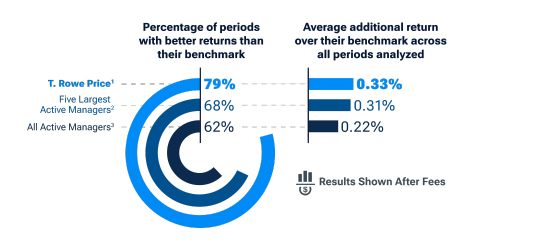
Active Management Makes a Difference
Our strategies delivered higher average returns than their benchmark over time. Plus, they beat their benchmark more frequently—and with better returns—than the average of all active managers.

U.S. Equity


Limiting investors' losses is just as important as—and goes hand in hand with—delivering growth. Our experience and approach have allowed us to both identify potential long-term winners and limit losses in the U.S. market in a variety of economic environments. In both up and down markets our U.S. equity strategies delivered higher average returns than their benchmarks over time – that’s the T. Rowe Price difference.
All Fixed Income
High Yield Fixed Income
Our fixed income strategies also delivered higher average returns than their benchmark as they too benefit from our rigorous global research and independent thinking, leading to fresh insights. Our investment professionals collaborate to develop better questions for better decisions, knowing that identifying risks is as important as identifying opportunities.
The outperformance of our strategies stemmed from our experience and our commitment to rigorous global research, uncovered opportunities with strong return potential and a low risk of defaults and downgrades. Our flexible process enables us to explore the full capital structure, identifying high-conviction ideas by rating class, industry, and issuer.

All Equity
The outperformance in our equity strategies stemmed from our experience and commitment to rigorous global research, which allowed us to uncover equity investment opportunities with long-term growth potential.

More return. More often.
That's the T. Rowe Price difference.
Past performance is no guarantee of future results.
Learn how this works in practice.
Head of Global Equity Josh Nelson and Head of Global Equity Research Jay Nogueira recently discussed how the T. Rowe Price US Structured Research Strategy is a great example of how our collaborative culture and in-depth research inform our decision-making and help us in seeking to generate alpha for clients, both for the strategy itself and beyond.
See below for standardized returns and other information about the T. Rowe Price composites in this analysis.
View standardized returns and other information about the T. Rowe Price composites in this analysis.
Explore our related insights
Download the full study
Analysis by T. Rowe Price. Represents a comparison of all marketable institutional equity and fixed income composites compared with the official composite primary benchmark assigned to each. Excludes money market, asset allocation, and index/passive composites. In order to avoid double-counting in the analysis, specialized composites viewed as substantially similar to strategies already included (e.g. constrained strategies, ex-single country excluded strategies, etc.) are also excluded. Composite net returns are calculated using the highest applicable separate account fee schedule for institutional clients. An aggregated view of 10-year rolling monthly periods net returns from 1/1/05 to 12/31/24 is shown. All figures in USD.
All Strategies
179 composites covering 7,889 rolling 10-year periods.
2418 composites covering 40,600 rolling 10-year periods. The assets under management (AUM) as of 12/31/24 across all composites considered in the analysis are aggregated and those composites offered by the largest five firms determined by total AUM, identified via eVestment, other than T. Rowe Price, are grouped together here. Source: Nasdaq’s eVestment Analytics database.
36,686 composites covering 583,136 rolling 10-year periods. Source: Nasdaq’s eVestment Analytics database.
Equity Strategies
152 composites covering 5,553 rolling 10-year periods.
2285 composites covering 27,681 rolling 10-year periods. The assets under management (AUM) as of 12/31/24 across all composites considered in the analysis are aggregated and those composites offered by the largest five firms determined by total AUM, identified via eVestment, other than T. Rowe Price, are grouped together here. Source: Nasdaq’s eVestment Analytics database.
34,554 composites covering 397,757 rolling 10-year periods. Source: Nasdaq’s eVestment Analytics database.
US Equity Strategies
133 composites covering 3,833 rolling 10-year periods.
2154 composites covering 15,877 rolling 10-year periods. The assets under management (AUM) as of 12/31/24 across all composites considered in the analysis are aggregated and those composites offered by the largest five firms determined by total AUM, identified via eVestment, other than T. Rowe Price, are grouped together here. Source: Nasdaq’s eVestment Analytics database.
32,173 composites covering 210,275 rolling 10-year periods. Source: Nasdaq’s eVestment Analytics database.
Fixed Income Strategies
127 composites covering 2,336 rolling 10-year periods.
2175 composites covering 17,264 rolling 10-year periods. The assets under management (AUM) as of 12/31/24 across all composites considered in the analysis are aggregated and those composites offered by the largest five firms determined by total AUM, identified via eVestment, other than T. Rowe Price, are grouped together here. Source: Nasdaq’s eVestment Analytics database.
32,132 composites covering 185,379 rolling 10-year periods. Source: Nasdaq’s eVestment Analytics database.
High Yield Strategies
12 composites covering 138 rolling 10-year periods.
29 composites covering 987 rolling 10-year periods. The assets under management (AUM) as of 12/31/24 across all composites considered in the analysis are aggregated and those composites offered by the largest five firms determined by total AUM, identified via eVestment, other than T. Rowe Price, are grouped together here. Source: Nasdaq’s eVestment Analytics database.
3156 composites covering 14,041 rolling 10-year periods. Source: Nasdaq’s eVestment Analytics database.
202507-4634091