August 2024 / EQUITY
Are U.S. stocks too expensive?
Can levels of profitability and efficiency of U.S. tech companies be sustained?
Key Insights
- U.S. stocks appear expensive, thanks to high valuations for key technology companies.
- The real question is whether current profit levels in the U.S. tech sector can be sustained. The growth path for artificial intelligence will be critical.
Thus far in 2024, the U.S. economy has surprised to the downside. While the Bloomberg U.S. Economic Surprise Index entered negative territory in March, the S&P 500 Index had delivered a healthy return of 9.6% through August 5th—despite the recent sharp pullback. This disconnect has raised concerns that U.S. stocks are too expensive given the deteriorating backdrop.
U.S. stock valuations do appear high. As of August 5th, the forward price‑to‑earnings (P/E) ratio for the S&P 500 stood at 19.7 times earnings, still significantly higher than the 25‑year average of 16.4. The U.S. market also looked expensive when compared with other regional markets (Figure 1).
U.S. valuations appear high
(Fig. 1) Forward P/E for the S&P 500 versus 25‑year average and other regional markets
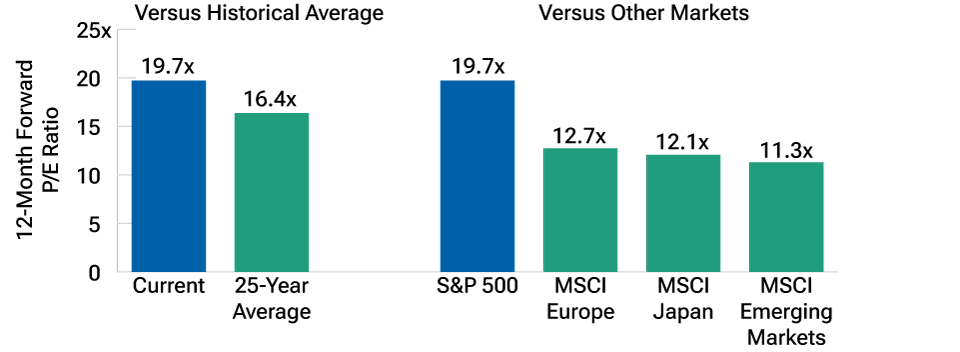
As of August 5, 2024. P/E averages calculated over monthly periods.
Actual future outcomes may differ materially from estimates.
Sources: T. Rowe Price analysis using data from FactSet Research Systems Inc. All rights reserved. Standard & Poor’s (see Additional Disclosures).
The tech sector distorts the picture
A closer look reveals that S&P 500 valuation has been distorted by extremely high P/Es for many U.S. tech companies—especially the mega‑cap stocks known collectively as the “Magnificent Seven.” This group includes Alphabet, Amazon, Apple, Meta, Microsoft, NVIDIA, and Tesla.1
As of August 5, the Magnificent Seven showed a collective forward P/E of 27.8, versus just 17.5 for the rest of the stocks in the S&P 500 (Figure 2). Those same seven stocks accounted for almost a third (31%) of S&P 500 market capitalization, while the technology sector as a whole made up 32%. Meanwhile, the financials and energy sectors combined accounted for only 16% of S&P 500 market cap at the end of June.
Impact of mega‑cap technology stocks
(Fig. 2) S&P 500 valuations with and without the Magnificent Seven1
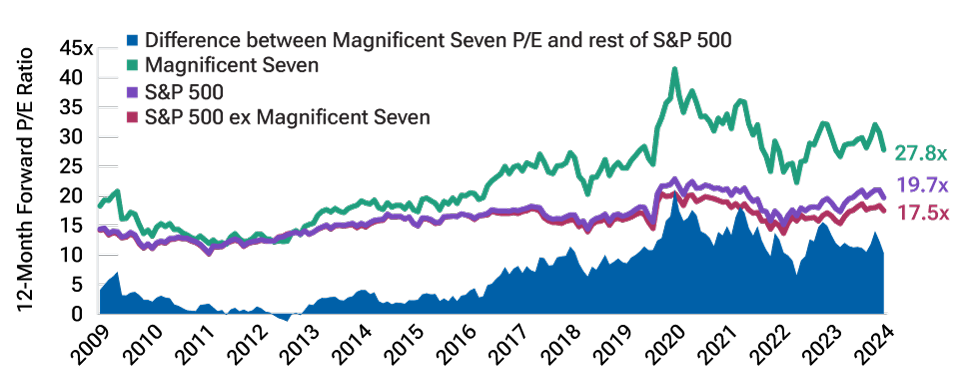
July 31, 2009, through August 5, 2024.
Actual outcomes may differ materially from forward estimates.
P/E (price‑to‑earnings) ratios are market cap weighted.
Sources: T. Rowe Price analysis using data from FactSet Research Systems Inc. All rights reserved. S&P 500 Index (see Additional Disclosures).
1The “Magnificent Seven” stocks are Apple, Alphabet, Amazon, Meta, Microsoft, NVIDIA, and Tesla. The specific securities identified and described are for informational purposes only and do not represent recommendations. Not representative of an actual investment. There is no assurance that an investment in any security was or will be profitable.
This is notable because, like the Magnificent Seven, technology stocks in general tend to be more expensive than financials and energy stocks. So, comparing the current S&P 500 P/E with its historical average is not really an apples‑to‑apples comparison.
Return on equity is a reality check
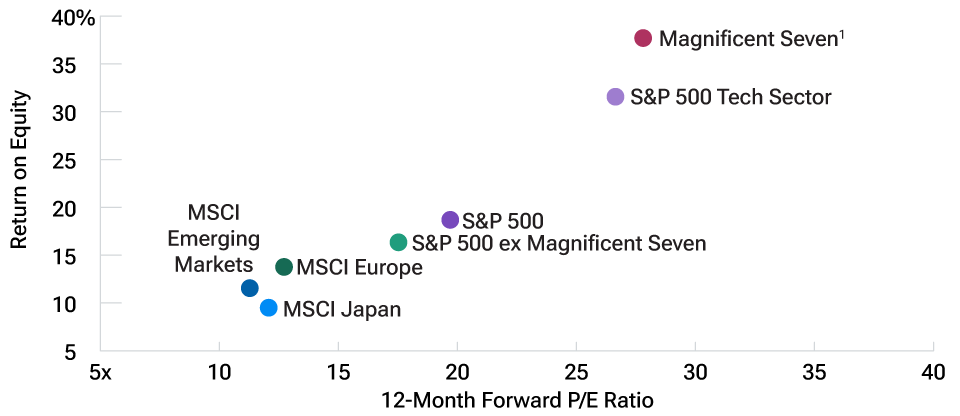
When evaluating individual companies with unusually high valuations, analysts often compare the P/E with the return on equity (ROE), a measure of how profitable and efficient the company has been. This same analysis can be applied to the S&P 500.
As of August 5, ROE was 37.7% for the Magnificent Seven and 31.5% for the S&P tech sector as a whole versus just 16.3% for the rest of the index. Other major regional markets also showed dramatically lower ROEs (Figure 3).
Return on equity is a reality check
(Fig. 3) ROE vs. forward P/E ratios for selected indexes
Past results are not a reliable indicator of future results. These statistics are not a projection of future results or company performance. Actual results may vary significantly.
ROEs are on a market cap‐weighted basis calculated for the trailing 12 months as of August 5, 2024.
1The “Magnificent Seven” stocks are Apple, Alphabet, Amazon, Meta, Microsoft, NVIDIA, and Tesla. The specific securities identified and described are for informational purposes only and do not represent recommendations. Not representative of an actual investment. There is no assurance that an investment in any security was or will be profitable.
Sources: T. Rowe Price analysis using data from FactSet Research Systems Inc. All rights reserved. MSCI and S&P indexes (see Additional Disclosures).
The bottom line is that valuation premiums for U.S. technology stocks, and for U.S. stocks in general, do not appear unreasonable in the context of profitability. While U.S. economic momentum has slowed, tech sector earnings have remained strong, thanks to the massive buildout of artificial intelligence (AI) infrastructure.
The real question is whether these elevated levels of profitability and efficiency can be sustained. Eventually, evidence will need to emerge that the substantial capital investments being made in AI will yield sufficient profits.
Additionally, if the U.S. economy weakens significantly, mega-cap tech companies may become much less willing to continue increasing their capital spending.
Conclusion
While U.S. stocks may seem overvalued, a deeper analysis suggests that these elevated valuations have been driven by exceptional profitability. However, the sustainability of those profit levels remains an open question. As a result, our Asset Allocation Committee currently holds a broadly neutral allocation to U.S. equities.
Additional Disclosures
CFA® and Chartered Financial Analyst® are registered trademarks owned by CFA Institute.
The S&P 500 Index is a product of S&P Dow Jones Indices LLC, a division of S&P Global, or its affiliates (“SPDJI”) and has been licensed for use by T. Rowe Price. Standard & Poor’s® and S&P® are registered trademarks of Standard & Poor’s Financial Services LLC, a division of S&P Global (“S&P”); Dow Jones® is a registered trademark of Dow Jones Trademark Holdings LLC (“Dow Jones”). This product is not sponsored, endorsed, sold or promoted by SPDJI, Dow Jones, S&P, or their respective affiliates, and none of such parties make any representation regarding the advisability of investing in such product(s) nor do they have any liability for any errors, omissions, or interruptions of the S&P 500 Index.
MSCI and its affiliates and third party sources and providers (collectively, “MSCI”) makes no express or implied warranties or representations and shall have no liability whatsoever with respect to any MSCI data contained herein. The MSCI data may not be further redistributed or used as a basis for other indices or any securities or financial products. This report is not approved, reviewed, or produced by MSCI. Historical MSCI data and analysis should not be taken as an indication or guarantee of any future performance analysis, forecast or prediction. None of the MSCI data is intended to constitute investment advice or a recommendation to make (or refrain from making) any kind of investment decision and may not be relied on as such.
IMPORTANT INFORMATION
This material is being furnished for general informational and/or marketing purposes only. The material does not constitute or undertake to give advice of any nature, including fiduciary investment advice, nor is it intended to serve as the primary basis for an investment decision. Prospective investors are recommended to seek independent legal, financial and tax advice before making any investment decision. T. Rowe Price group of companies including T. Rowe Price Associates, Inc. and/or its affiliates receive revenue from T. Rowe Price investment products and services. Past performance is not a reliable indicator of future performance. The value of an investment and any income from it can go down as well as up. Investors may get back less than the amount invested.
The material does not constitute a distribution, an offer, an invitation, a personal or general recommendation or solicitation to sell or buy any securities in any jurisdiction or to conduct any particular investment activity. The material has not been reviewed by any regulatory authority in any jurisdiction.
Information and opinions presented have been obtained or derived from sources believed to be reliable and current; however, we cannot guarantee the sources' accuracy or completeness. There is no guarantee that any forecasts made will come to pass. The views contained herein are as of the date noted on the material and are subject to change without notice; these views may differ from those of other T. Rowe Price group companies and/or associates. Under no circumstances should the material, in whole or in part, be copied or redistributed without consent from T. Rowe Price.
The material is not intended for use by persons in jurisdictions which prohibit or restrict the distribution of the material and in certain countries the material is provided upon specific request.
It is not intended for distribution to retail investors in any jurisdiction.
August 2024 / STRATEGY SPOTLIGHT
August 2024 / MARKETS & ECONOMY

Tim Murray is a capital market strategist in the Multi-Asset Division. Tim is a vice president of T. Rowe Price Associates, Inc.