
Choose your location
Canada
English
Austria
Belgium
Denmark
Estonia
Finland
France
Iceland
Ireland
Italy
Latvia
Lithuania
Luxembourg
Netherlands
Norway
Portugal
Spain
Sweden
Switzerland
United Kingdom

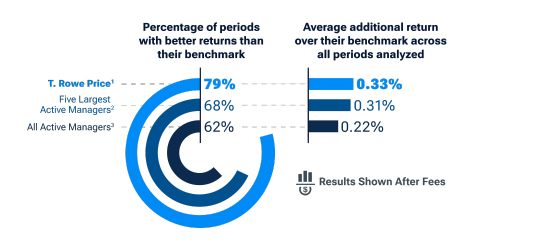
Our strategies beat their benchmarks more often – and at a higher level – than competitors.*
T. Rowe Price equity and fixed income strategies delivered higher average returns than their benchmarks 80% of the time. Plus, they beat their benchmark more frequently—and with better returns—than the average of all active managers. Dive into our active management composite study and learn more about how we achieved this.
See below for standardized returns and other information about the T. Rowe Price composites in this analysis.
Video Player is loading.
Our study covers both equity and fixed income strategies. Learn more about the results of each asset class.


More return. More often.
That's the T. Rowe Price difference.
Past performance is no guarantee of future results.
Learn how this works in practice.
Our head of Institutional Client Service Kim Young recently sat down with Eric Veiel, head of Global Equity and CIO, to discuss how the T. Rowe Price active management approach works on a daily basis, what advantages it brings and how it helps us in seeking to generate alpha for clients.
Video Player is loading.
Explore our related insights


Download the full study
*Ten-year periods, rolling monthly, over the last 20 years ended 12/31/23.
Analysis by T. Rowe Price. Represents a comparison of all marketable institutional equity and fixed income composites compared with the official composite primary benchmark assigned to each. Excludes money market, asset allocation, and index/passive composites. An aggregated view of 10-year rolling monthly periods net returns from 1/1/2004 to 12/31/23 is shown. All figures in USD. Competitor data is sourced from Nasdaq’s eVestment Analytics database, and calculated on available net performance over manager selected benchmark figures for comparable products selected based on eVestment Primary Universe and eA Universe Classifications. All Equity or Fixed Income Composites considered except SMA/Wrap – Other, Liquid Real Assets, All Lifestyle/Target Risk Aggressive. Performance information reported by eVestment Alliance is self-reported by contributing firms and is unaudited. Results from other time periods may differ.
Number and Time Periods of Composites
All Strategies
180 composites covering 8,080 rolling 10-year periods.
2435 composites covering 42,038 rolling 10-year periods. The assets under management (AUM) as of 12/31/23 across all composites considered in the analysis are aggregated and those composites offered by the largest five firms determined by total AUM, identified via eVestment, other than T. Rowe Price, are grouped together here. Source: Nasdaq’s eVestment Analytics database.
36,541 composites covering 553,935 rolling 10-year periods. Source: Nasdaq’s eVestment Analytics database.
Equity Strategies
152 composites covering 5,525 rolling 10-year periods.
2302 composites covering 28,343 rolling 10-year periods. The assets under management (AUM) as of 12/31/23 across all composites considered in the analysis are aggregated and those composites offered by the largest five firms determined by total AUM, identified via eVestment, other than T. Rowe Price, are grouped together here. Source: Nasdaq’s eVestment Analytics database.
34,453 composites covering 377,358 rolling 10-year periods. Source: Nasdaq’s eVestment Analytics database.
US Equity Strategies
133 composites covering 3,809 rolling 10-year periods.
2175 composites covering 17,938 rolling 10-year periods. The assets under management (AUM) as of 12/31/23 across all composites considered in the analysis are aggregated and those composites offered by the largest five firms determined by total AUM, identified via eVestment, other than T. Rowe Price, are grouped together here. Source: Nasdaq’s eVestment Analytics database.
32,338 composites covering 218,624 rolling 10-year periods. Source: Nasdaq’s eVestment Analytics database.
Fixed Income Strategies
128 composites covering 2,555 rolling 10-year periods.
2178 composites covering 17,655 rolling 10-year periods. The assets under management (AUM) as of 12/31/23 across all composites considered in the analysis are aggregated and those composites offered by the largest five firms determined by total AUM, identified via eVestment, other than T. Rowe Price, are grouped together here. Source: Nasdaq’s eVestment Analytics database.
32,088 composites covering 176,577 rolling 10-year periods. Source: Nasdaq’s eVestment Analytics database.
High Yield Strategies
12 composites covering 130 rolling 10-year periods.
210 composites covering 1,083 rolling 10-year periods. The assets under management (AUM) as of 12/31/23 across all composites considered in the analysis are aggregated and those composites offered by the largest five firms determined by total AUM, identified via eVestment, other than T. Rowe Price, are grouped together here. Source: Nasdaq’s eVestment Analytics database.
3153 composites covering 13,687 rolling 10-year periods. Source: Nasdaq’s eVestment Analytics database.
Risks: All investments are subject to risk, including the possible loss of principal. Equity security prices can be volatile which may result in gains or losses. Fixed income securities are subject to credit risk, liquidity risk, call risk, and interest rate risk. As interest rates rise, bond prices generally fall.
202405-3573422