
August 2024 / MULTI-ASSET
Will government debt boil the frog?
How much should investors worry about the ballooning U.S. government debt?
Key Insights
- The U.S. debt-to-gross domestic product (GDP) ratio is near an all-time high and is projected to continue increasing.
- But the U.S. has reduced its debt-to-GDP ratio significantly before. This happened three times: after WWI, after WWII, and in the 1990s.
- From an investment perspective, after researching this topic, I’m not too worried about the impact of the high debt on the economy and markets over the next 12 months.
Slow and incremental changes can lull business leaders into complacency. Here’s a popular metaphor in business strategy meetings: Self-satisfied companies are like a frog sitting in a pot of slowly heating water—they won’t notice anything’s amiss until they’re boiled alive.
If your competitors are taking market share a little bit every year, ask yourself: Are you in danger of becoming a slow-boiled frog?
A good example of this metaphor in macroeconomics might be the slowly but surely increasing level of U.S. government debt. It hasn’t had disastrous economic consequences, but the temperature has been rising. Is the water about to boil?
(The slow-boiling frog story is a fabrication. Dr. George R. Zug, curator of reptiles and amphibians at the National Museum of Natural History, uses a different term (similar to “bullfrog”), and insists that “if a frog had a means of getting out, it certainly would get out.” 1)
Over the last couple of weeks, I worked on this question with Blerina Uruçi, T. Rowe Price’s chief U.S. economist. She deserves much of the credit for the following analysis, although errors and opinions are my own.
Perhaps we have the means of getting out from under this mountain of debt. Perhaps we will. We have done so in the past. And if we don’t, perhaps the temperature will stay constant for quite a while, and we’ll learn to live with a high level of debt.
To tell you the truth, I hesitated to write about this topic. It can get political very fast. But I decided to publish this note because I continue getting questions on the scary level of U.S. government debt from clients. I’ll focus on economics and financial markets. I’ll present both sides: reasons to worry and reasons not to worry about the debt. Please read what follows as an apolitical analysis.
Here’s where my LinkedIn followers stood on a recent survey: 44% of you are worried, 9% don’t know, and 47% are not worried. This split result reveals that it’s a topic worth discussing.

Reasons to worry
The U.S. debt-to-gross domestic product (GDP) ratio is near an all-time high and is projected to continue increasing, as shown below. The global financial crisis of 2008, COVID stimulus, and continued budget deficits contributed to this situation.
(Fig. 1) U.S. debt, percent of U.S. GDP

Sources: Dates for U.S. Debt to GDP 1900 to 1942—Jordà-Schularick-Taylor, Macrohistory Database; 1943 to 2023—St. Louis FRED; 2024 to 2029 Projections—Office of Management and Budget/Haver Analytics.
Source for Recession Classification: National Bureau of Economic Research/Haver Analytics.
Given higher rates and a large stock of debt, interest expense has risen to near an all-time high and is projected to continue increasing until it surpasses any level ever seen as a percentage of GDP in the U.S.
In 2024, the interest expense is projected to rise above the cost of national defense. It’s expected to become the third-largest expense after Medicare/Medicaid and Social Security. Based on his research on decades (even centuries) of data across countries, historian Niall Ferguson has issued an ominous warning about this type of situation:
(Fig. 2) Net interest expense, percent of U.S. GDP

Source: Congressional Budget Office 1940–2023. Projected values 2024 through 2034.
“If you really want to see when an empire is getting vulnerable, the big giveaway is when the costs of servicing the debt exceed the cost of the defense budget."2
Are you worried yet? Let me give you one more reason to lose sleep over the debt: The current level of deficits (excluding debt service) is unusually high. It’s not consistent with 4% unemployment, which typically gives little need to stimulate the economy, at least based on historical data. Deficits ballooned as could be expected during the pandemic, but we’ve had difficulty readjusting to normal.
The chart below shows that based on the historical relationship, excluding the extraordinary pandemic years of 2020 and 2021, the current level of deficits would be more consistent with unemployment in the 8% range. To see this, take the yellow dot for 2023 and draw a line to the historical relationship (blue dotted line).
(Fig. 3) U.S. deficit (primary balance) vs. U.S. unemployment (excluding 2020 and 2021)

Sources: Primary Balance % of GDP: CBO/Haver Analytics; Unemployment Rate: BLS/Haver Analytics from 1965 through 2023. Note: 2020 and 2021 data points have been omitted due to impact of pandemic response.
For my LinkedIn survey, I focused on the 12-month horizon. But several of these issues may be “slow boiling.” Had I asked my followers if they were worried about government debt with a 5- or 10-year horizon, perhaps the results would have tilted on the worried side.
Reasons not to worry
What are the reasons not to worry?
First, the effect of higher rates may be muted because much of the long-term borrowing took place when rates were at rock-bottom levels. The chart below shows that the effective interest rate—the weighted average rate the U.S. government pays on its debt, as opposed to the current interest rate—remains low.
(Fig. 4) Effective interest rate

Sources: Average Interest Rate: Treasury/Haver Analytics from 1952 to 2023.
* CBO Projection sourced from Congressional Budget Office with projections covering 2024 through 2054.
The current average mortgage rate in the U.S. is over 7%.3 When I presented at a conference a few weeks ago, I asked over 300 attendees to raise their hands if their mortgage rate on their house was below 4%. About 90% of attendees raised their hands. Most homeowners refinanced their mortgage when rates were much lower. The effective mortgage rate in the U.S. is 3.78%, much lower than the current rate of 7% for new 30‑year mortgages.
Corporations and the U.S. government similarly refinanced their long-term debt at ultralow rates. As a result, the 550 basis points in Fed hikes have impacted the economy much less than expected.
You might counter that the amount of debt is so high that the total dollar value of the interest expense is skyrocketing. Yes, but the Fed is expected to cut rates. So long-term rates may not bite as much if they come down before the government needs to roll the maturing long-term debt. (This assumes that short- and long-term rates are correlated, which is not always true.) And lower short-term rates will provide immediate relief for the stock of short-term debt.
To be clear, I don’t know how strong this argument is because it contradicts the official U.S. Congressional Budget Office (CBO) projections for net interest expense, as shown earlier.4
Another reason not to worry is that the U.S. has reduced its debt-to-GDP ratio significantly before. This happened three times: after WWI, after WWII, and in the 1990s. Figure 1, titled “U.S. debt, percent of U.S. GDP,” identifies these periods with red bars on the x-axis.
There are three ways to reduce the debt-to-GDP ratio:
- reduce the deficit (spend less or tax more);
- reduce the cost of the debt by reducing interest rates, as discussed above; and
- grow GDP (at a higher rate than the real interest rate).5
(Inflation is a fourth way, but it doesn’t always work. There are nuances with government debt. Inflation increases the denominator (GDP), increases tax revenues, and devalues the money used to pay the interest on the debt (per my intuitive example). These effects reduce debt.
However, inflation tends to increase the interest rate and government expenses. Academics continue to debate the net effect of inflation on the debt-to-GDP ratio, which depends on many variables. “The bottom line is that if you want to inflate away your debt, you also need to cap interest rates, which is called financial repression,” as Blerina explains.)
These debt reduction measures are difficult and unlikely in the current political environment—and any one alone seems insufficient. Also, pushing deficit reductions or financial repression too hard could have negative side effects.
Still, perhaps we’ll combine these measures with decent GDP growth so that the frog can jump out before it boils. It’s been done before.
(Fig. 5) U.S. debt in international context

Source: IMF/Haver Analytics from 1900 to 2029. Represented as Public Debt (% of GDP) from 1900 through 2015 and General Government Gross Debt (% of GDP) from 2016 through 2029. Data from 2024 through 2029 are IMF projections.
Another popular reason not to worry is the strong demand for U.S. debt. Even if the ratio of debt to GDP is increasing and inflation could devalue the U.S. dollar, Arslanalp and Eichengreen (2023) explain that there’s a “global safe-asset shortage.” Debt-to-GDP ratios are rising everywhere. The chart above shows the examples of the UK, Italy, and Japan.
Hence, U.S. debt may remain the cleanest dirty shirt, and the U.S. dollar may remain the reserve currency held by central banks and used for financial transactions—a privilege that allows the U.S. to enjoy “deficits without tears,” a French economist once ruefully observed.6
Also, we can live with higher debt levels. In this scenario, the frog can adapt to warmer water. Have you ever heard of the most famous Excel error ever made in economics? Here are two of my favorite headlines about it:
From Bloomberg Business Week (April 18, 2013):
“Reinhart, Rogoff, and the Excel Error That Changed History”
From The Conversation (April 22, 2013):
“The Reinhart-Rogoff error—or how not to Excel at economics”
In their original study, respected economists Carmen Reinhart and Kenneth Rogoff concluded that countries with a debt-to-GDP ratio above 90% experienced negative growth (-0.1%). However, when another team of academics tried to replicate the study, their result was +2.2%. Reinhart and Rogoff “had not selected the entire row when averaging growth figures: They omitted data from Australia, Austria, Belgium, Canada, and Denmark."7
As a caveat, despite the obvious error, the academic debate continues on this question. My conclusion is that it’s not a given that high debt means low growth. It depends, and the U.S. is in a unique situation, given the high demand for its debt.
Last, during periods of declining debt—perhaps counterintuitively given that fiscal austerity should typically restrain growth—it turns out that stocks performed better than average, as shown below. Remember that you can also improve the debt-to-GDP ratio by growing the economy.
(Fig. 6) U.S. stocks vs. U.S. bonds when debt/GDP was declining

Past performance is not a reliable indicator of future performance.
Sources: For Debt to GDP, see above. 1900 to 1942, Jordà-Schularick-Taylor Macrohistory Database; 1943 to 2023, St. Louis FRED. Stocks represented by U.S. large-cap equity returns, 1900–1925, Jordà-Schularick-Taylor Macrohistory Database; 1926–2023, Morningstar Direct (SBBI historical data). Bonds represented by U.S. long-term government bond returns, 1900–1925, Jordà‑Schularick‑Taylor Macrohistory Database; 1926–2023, Morningstar Direct (SBBI historical data).
Takeaways
The level of U.S. government debt creates vulnerabilities, especially if we face a recession. Debt has reached unprecedented levels. The cost of paying the interest on this debt is surpassing defense spending. This is a long-term issue.
However, there are reasons not to panic, at least not for now. We’ve brought debt levels down before, but if we can’t, there’s some evidence that high debt doesn’t automatically kill growth—especially for a country whose historically safe debt is in high demand.
From an investment perspective, after researching this topic, I’m not too worried about the impact of the high debt on the economy and markets over the next 12 months.
To end on a low note, however (because ending on a high note is cliché), the long-term question remains: Is the temperature slowly rising toward a point when U.S. debt is no longer considered the safest asset in the world?
Thank you to Blerina Uruçi, Rob Panariello, Charles Shriver, and Chris Faulkner‑MacDonagh for their help with this analysis.
1From the Oct. 95 issue of Fast Company. https://www.sagaleadership.com/blog/management-myth-busted-the-boiled-frog?_sm_pdc=1&_sm_rid=NsMTk6jSs7H2Q2RD7j6VD7Mq3Fq3DVk66Nt0j5q
2At the Aspen Ideas Festival, 2010, https://www.businessinsider.com/niall-ferguson-the-us-has-6-years-before-debt-payments-surpass-defense-spending-2010-7
3Bloomberg. Bankrate 30Y Mortgage Rates Index, 7/18/2024.
4https://www.cbo.gov/publication/60419
5Here’s a nice framework proposed by Arslanalp and Eichengreen at the Jackson Hole meeting in 2023:
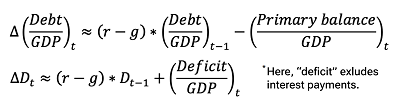
The second equation simplifies the first one. “D” is debt expressed as a percentage of GDP, “r” is the real interest rate, “g” is real GDP growth, and “Deficit” is the primary balance, which means expenses minus revenues, excluding the interest on the debt.
6Rueff, Jacques. 1972. The Monetary Sin of the West. New York: The MacMillan Company.
7https://theconversation.com/the-reinhart-rogoff-error-or-how-not-to-excel-at-economics-13646
Additional Disclosure
©2024 Morningstar, Inc. All rights reserved. The information contained herein: (1) is proprietary to Morningstar and/or its content providers; (2) may not be copied or distributed; and (3) is not warranted to be accurate, complete, or timely. Neither Morningstar nor its content providers are responsible for any damages or losses arising from any use of this information. Past performance is no guarantee of future results.
Important Information
This material is being furnished for general informational and/or marketing purposes only. The material does not constitute or undertake to give advice of any nature, including fiduciary investment advice. Prospective investors are recommended to seek independent legal, financial and tax advice before making any investment decision. T. Rowe Price group of companies including T. Rowe Price Associates, Inc. and/or its affiliates receive revenue from T. Rowe Price investment products and services. Past performance is not a reliable indicator of future performance. The value of an investment and any income from it can go down as well as up. Investors may get back less than the amount invested.
The material does not constitute a distribution, an offer, an invitation, a personal or general recommendation or solicitation to sell or buy any securities in any jurisdiction or to conduct any particular investment activity. The material has not been reviewed by any regulatory authority in any jurisdiction.
Information and opinions presented have been obtained or derived from sources believed to be reliable and current; however, we cannot guarantee the sources’ accuracy or completeness. There is no guarantee that any forecasts made will come to pass. The views contained herein are as of the date written and are subject to change without notice; these views may differ from those of other T. Rowe Price group companies and/or associates. Under no circumstances should the material, in whole or in part, be copied or redistributed without consent from T. Rowe Price.
The material is not intended for use by persons in jurisdictions which prohibit or restrict the distribution of the material and in certain countries the material is provided upon specific request. It is not intended for distribution to retail investors in any jurisdiction.
USA—Issued in the USA by T. Rowe Price Associates, Inc., 100 East Pratt Street, Baltimore, MD, 21202, which is regulated by the U.S. Securities and Exchange Commission. For Institutional Investors only.
© 2024 T. Rowe Price. All Rights Reserved. T. ROWE PRICE, INVEST WITH CONFIDENCE, and the Bighorn Sheep design are, collectively and/or apart, trademarks of T. Rowe Price Group, Inc.
August 2024 / GLOBAL EQUITIES

Sébastien Page is head of Global Multi-Asset and chief investment officer. He is a member of the Asset Allocation Committee, which is responsible for tactical investment decisions across asset allocation portfolios. Sébastien also is a member of the Management Committee of T. Rowe Price Group, Inc.