August 2024 / FIXED INCOME
Perspectives on securitized credit
Although the rally lost some momentum in Q2, securitized credit markets still performed well
Key Insights
- The rally in securitized credit markets lost some momentum in the second quarter, but the asset class still performed well on an absolute basis and relative to investment-grade corporate credit.
- New issuance has been abundant this year and shows no signs of slowing, which could create some more attractively priced opportunities.
- Credit fundamentals are mostly benign, and we currently see the most value in asset-backed securities.
Securitized credit sectors performed well entering the second quarter (Q2), extending a strong run that began in late 2023, when Federal Reserve policymakers signaled that the rate-hiking cycle was probably finished. But the prolonged rally lost steam around late April/early May as investors became fatigued in the face of rampant new issuance, which has been a key theme for our markets this year. Credit spreads1 drifted wider over the subsequent two months and generally ended Q2 near where they started. Still, total and excess returns2 largely remained in positive territory due to the sectors’ yield premiums versus U.S. Treasuries (Figure 1).
Securitized credit spreads lost tightening momentum in Q2 2024
(Fig. 1) Returns were still broadly positive due to coupon income
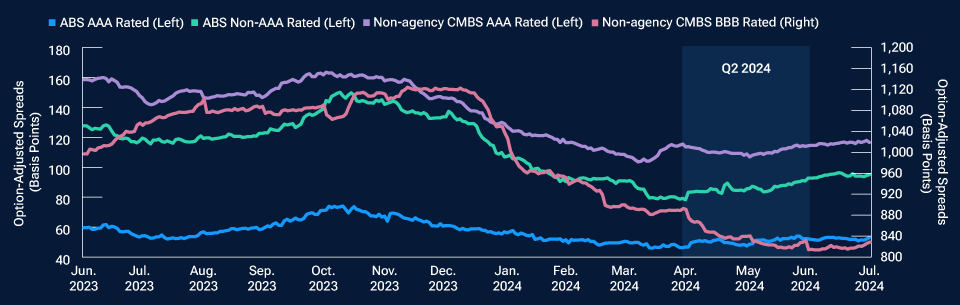
June 30, 2023, through July 31, 2024. Past performance is not a reliable indicator of future performance.
Source: Bloomberg Index Services Limited. Please see Additional Disclosures page for additional information.
Indexes shown are different credit quality tranches of the Bloomberg Non-Agency Investment-Grade CMBS Index and the Bloomberg ABS Index.
A basis point equals one hundredth of one percentage point, or 0.01%.
Index data are for illustrative purposes only and are not indicative of any specific investment. Investors cannot invest directly in an index.
Broadly positive performance
Treasury yields ended the quarter higher due to a sharp sell-off in April that weighed on total returns for most major fixed income sectors. The rate rout followed hotter-than-expected inflation reports and comments from Fed policymakers indicating that, while they were contemplating lowering interest rates, they were in no rush to do so without more evidence that inflation is definitively cooling. Yields then retraced much of the April spike over the next two months as disinflation resumed and economic growth data largely disappointed. The Treasury market rebound, combined with coupon income, led to positive total returns, particularly in shorter-duration3 securitized segments like asset-backed securities (ABS) and collateralized loan obligations (CLOs).
In contrast with investment-grade corporate bonds, which experienced their first negative quarter of excess returns since 2022, excess returns for major securitized credit sectors were broadly positive in Q2.
Non-agency commercial mortgage-backed securities (CMBS) produced excess returns of 0.21% at the overall index level.4 This was largely driven by lower-quality CMBS, which benefited from expectations for lower rates, a resilient U.S. economy, and their high yields, which led to continued spread tightening from wide levels. Performance for CMBS backed by office buildings was quite mixed, though. High‑quality properties tended to perform well, and some deeply discounted bonds rebounded as investors reassessed their terminal value. However, some other office bonds repriced lower due to factors such as appraisal reductions, expected tenant departures, maturity extensions, and increased default concerns.
Asset-backed securities generated comparable excess returns of 0.17%, with non-AAA rated ABS outperforming on the back of their higher spread carry.5 Within the ABS index, prime and subprime auto loans were top-performing subsectors. Areas outside of the benchmark, such as private student loans, whole-business securitizations, and data centers, also performed well.
CLOs6 produced steady results over the quarter, leading to solid overall total returns of 2.07%,7 which equates to excess returns of roughly 0.70%. Similar to the ABS and CMBS markets, lower-quality CLO tranches were performance leaders as tight spreads at the AAA level drove investors down the capital structure in search of better value.
In non-agency residential mortgage‑backed securities (RMBS), which lack a broad market benchmark, performance was positive for major subsectors. From our vantage point, credit risk transfer securities (CRTs) produced some of the best results as issuance was relatively light and demand was solid.8 Returns were less robust for nonqualified mortgages (non-QM) and single-family rentals as demand for new issuance waned toward the end of the quarter. With a longer duration profile, returns were more subdued for jumbo mortgage bonds as Treasury yields rose during the quarter.
Supply wave continued
Issuance remained abundant across securitized credit sectors (Figure 2). As of early July, RMBS issuance, at USD 67 billion, was not far below the total for all of 2023. Although demand has been strong, the market began to feel some indigestion more recently.9
Heavy new issuance across U.S. securitized credit sectors in 2024
(Fig. 2) Supply has been relatively well digested to date
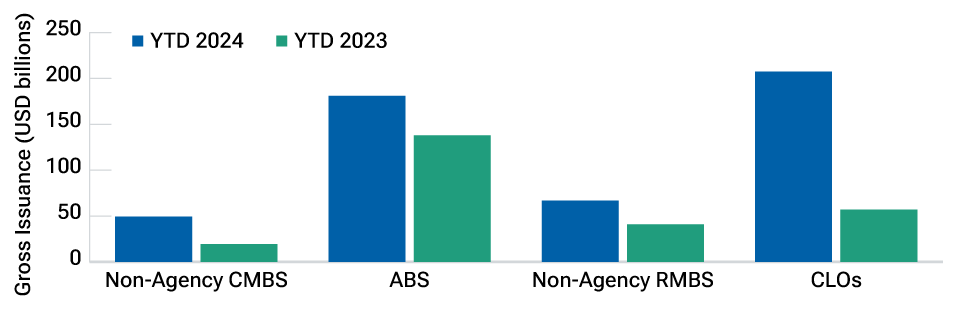
As of July 12, 2024.
Source: J.P. Morgan.
Private-label CMBS issuance climbed 155% from last year’s midpoint and sat at USD 49 billion year-to-date. Higher rates and well-publicized troubles in the commercial property market put a damper on issuance last year. But this year, issuers took advantage of more favorable market conditions and somewhat lower interest costs to refinance existing loans and issue new debt. Issuance in the single-asset/single‑borrower subsector, where most bonds are floating rate, was especially robust.
Meanwhile, the ABS market is on track for a record year of new supply. Issuance stood near USD 181 billion year-to-date, and the supply pipeline shows no signs of slowing in the second half of 2024. This has been driven by auto-related subsectors, but issuance was higher than at last year’s midpoint in most segments. More esoteric areas of the ABS market, such as whole business, data center, device payment, and solar securitizations saw a considerable increase in supply as issuers took advantage of easier financial conditions and strong investor demand. The market has also seen a notable increase in synthetic credit risk transfers, which allow banks to hedge risk on consumer loan portfolios and reduce capital burdens amid regulatory uncertainty.
CLO gross issuance was likewise on a record-setting pace, sitting around USD 207 billion in early July. More than half of that total resulted from refinancings and resets of previously issued deals. The refinancing and reset surge stems from spread compression for CLO liabilities; a large number of CLOs exiting their reinvestment periods, which means that CLO managers can no longer actively buy and sell loans in their portfolios; and a refinancing wave in the underlying loan market, where many loans are priced at or above par value, incentivizing companies to refinance before maturity.
Valuations generally fair to rich
Although spreads widened somewhat in recent weeks, valuations are broadly fair or expensive, based on our historical analysis, following a months-long rally. ABS generally look cheaper than other sectors, while CLOs are on the expensive side of fair. Pricing for CMBS appears reasonable, with some cheapening recently seen at the higher end of the capital structure. Valuations for RMBS are mixed. The credit curve is very flat for CRTs (i.e., spreads on lower-quality issues are tight relative to higher quality), and the subsector broadly looks expensive following strong recent performance. Somewhat better value can be found in the non-QM and reperforming loan subsectors. However, delinquencies on non-QM loans have risen, and continued heavy supply could work against spread tightening.
Fundamentals mostly unconcerning
- ABS fundamentals look relatively neutral but are deteriorating at the margin. Consumer bankruptcies are increasing yet remain well below the levels of the last decade. And, outside of student loans, delinquency rates on consumer loans have also risen from the lows seen during the pandemic. Delinquencies of 90 days or more on credit cards and auto loans recently hit their highest level since 2011, according to the New York Fed Consumer Credit Panel and Equifax. A counterpoint is that credit card delinquencies have largely affected younger borrowers who have smaller balances, and auto loan delinquencies have primarily involved subprime loans, which compose a much smaller percentage of the ABS market than prime loans. Plus, ABS backed by subprime loans typically boast sturdier structures to account for the increased risk. We expect continued—but manageable—increases in delinquencies and losses across consumer ABS.
- CLO fundamentals have likewise deteriorated marginally. Leveraged loan downgrades have outpaced upgrades, a trend we expect will continue. The loan default rate has risen from its cycle lows but has actually dipped slightly this year to 3.1% at the end of June, per J.P. Morgan. Due in part to CLO demand for collateral, loan issuers have had easy access to the primary market to refinance and extend maturities, and our high yield team expects the default rate to remain manageable. In our view, the BB rated tranches of CLOs will be most adversely affected by loan downgrades, defaults, and liability management exercises that force bondholders to take haircuts. We have few concerns about more senior CLO tranches, though collateral and credit underwriting strength differ for every deal.
- CMBS clearly have the most fundamental concerns, but these vary across the sector and are well known by the market. As highlighted in the financial press, delinquencies, transfers to special servicing, and negative headlines are most evident in the office segment. According to KBRA Analytics, about 31% of all office loans were in default or at risk of default at the end of March, up from 16% a year ago. Although office properties are the primary concern, net cash flows recently appear to be declining in the lodging segment, a trend that bears watching. Cash flows are stable for industrial and multifamily properties. Spread levels look compelling in the subordinate part of the market. But our base-case fundamental assumptions imply that investors will not fully realize these spreads due to losses and extensions. Indeed, during the past quarter, a CMBS backed by a New York office building endured losses at the AAA rated level—an event that hasn’t occurred since the 2008 global financial crisis. This type of event highlights the importance of deep analysis and prudent security selection.
- RMBS fundamentals are relatively solid. Delinquencies have crept higher for non‑QM bonds, but they have been stable or declining in other segments. Housing sales data have recently weakened due to increasingly unaffordable prices, high mortgage rates, and limited inventory in many parts of the country. However, home prices remain on an uptrend, providing homeowners with more equity, and Fed rate cuts could help with the affordability issue. A slowdown in hiring and higher unemployment could eventually become a concern but is currently a nonissue.
Best opportunities in ABS
As noted, we see the best relative value in ABS, a sector whose shorter spread duration should limit downside risk compared with other credit sectors if we experience a broader risk asset sell-off. Within the sector, we see opportunities in synthetic prime auto bonds, which are issued by banks looking to unload risk on their loan books. We also favor discount‑priced whole-business securitizations, subordinate prime auto bonds, and senior and subordinate equipment and auto dealer floor plan ABS. We are warier of areas like bank credit cards, solar financing, federal student loans, and consumer loans.
In CMBS, we favor new issue conduit deals, with a preference for more senior paper. These offer diversified collateral, and more recent issues benefit from enhanced underwriting and less office exposure compared with seasoned conduit bonds. We had been looking to avoid the retail sector, as shopping malls face secular challenges and store closures have increased. However, a favorable financing environment and investor demand have improved the quality of assets, lifting our view. Within retail, we prefer smaller, open-air shopping centers over enclosed malls and favor properties featuring grocers and other needs-based providers over discretionary shops. We had liked the lodging and industrial subsectors, but the team recently downgraded their view to neutral. Many strong lodging bonds have been refinanced, which was a key element of our investment thesis and limits further upside. And the industrial complex has seen heavy issuance, very optimistic underwriting assumptions, and low debt service coverage ratios.
RMBS should benefit from continued home price appreciation, and fundamentals appear fine. Lower rates should lift the prices of discounted bonds, valuations have recently improved in some areas, and there are specific bonds that offer solid return potential and potentially less downside risk from more interest rate volatility. On the downside, we expect a glut of issuance to remain a headwind, a large rate rally would be negative for more recently issued bonds that are priced at premiums, and U.S. election uncertainty could trigger volatility. Within the sector, we are biased toward higher quality, but we like seasoned single-family rentals across the quality spectrum. And we see opportunities in discounted bonds backed by hybrid adjustable rate mortgages in different market segments.
Lastly, in CLOs, we continue to like senior AAA rated tranches. AA rated bonds are screening as less expensive versus comparable investment-grade corporate bonds but more expensive than AAA CLOs. We do see some value in A rated CLOs for portfolios that can accept the higher risk. And we believe that BBs are the area of the CLO capital structure most vulnerable to deteriorating bank loan fundamentals and are an area we are currently avoiding.
Additional Disclosures
“Bloomberg®” and the Bloomberg ABS, Bloomberg Non‑Agency Investment Grade CMBS: Eligible for U.S. Aggregate Indexes, and the Bloomberg U.S. Corporate Investment Grade Index are services marks of Bloomberg Finance L.P. and its affiliates, including Bloomberg Index Services Limited (“BISL”), the administrator of the index (collectively, “Bloomberg”) and have been licensed for use for certain purposes by T. Rowe Price. Bloomberg is not affiliated with T. Rowe Price, and Bloomberg does not approve, endorse, review, or recommend this product. Bloomberg does not guarantee the timeliness, accurateness, or completeness of any data or information relating to this product.
Information has been obtained from sources believed to be reliable, but J.P. Morgan does not warrant its completeness or accuracy. The index is used with permission. The index may not be copied, used, or distributed without J.P. Morgan’s prior written approval. Copyright © 2024, J.P. Morgan Chase & Co. All rights reserved.
IMPORTANT INFORMATION
This material is being furnished for general informational and/or marketing purposes only. The material does not constitute or undertake to give advice of any nature, including fiduciary investment advice, nor is it intended to serve as the primary basis for an investment decision. Prospective investors are recommended to seek independent legal, financial and tax advice before making any investment decision. T. Rowe Price group of companies including T. Rowe Price Associates, Inc. and/or its affiliates receive revenue from T. Rowe Price investment products and services. Past performance is not a reliable indicator of future performance. The value of an investment and any income from it can go down as well as up. Investors may get back less than the amount invested.
The material does not constitute a distribution, an offer, an invitation, a personal or general recommendation or solicitation to sell or buy any securities in any jurisdiction or to conduct any particular investment activity. The material has not been reviewed by any regulatory authority in any jurisdiction.
Information and opinions presented have been obtained or derived from sources believed to be reliable and current; however, we cannot guarantee the sources' accuracy or completeness. There is no guarantee that any forecasts made will come to pass. The views contained herein are as of the date noted on the material and are subject to change without notice; these views may differ from those of other T. Rowe Price group companies and/or associates. Under no circumstances should the material, in whole or in part, be copied or redistributed without consent from T. Rowe Price.
The material is not intended for use by persons in jurisdictions which prohibit or restrict the distribution of the material and in certain countries the material is provided upon specific request.
It is not intended for distribution to retail investors in any jurisdiction.
August 2024 / STRATEGY SPOTLIGHT

Chris Brown is the head of the Securitized Products team and a portfolio manager in the Fixed Income Division, where he co-manages the Total Return Bond Strategy and the U.S. Core Plus Bond separate accounts. He is the co-president and cochairman of the Investment Advisory Committee for the Total Return Fund, a vice president of the International Funds and Multi-Sector Account Portfolios, and a vice president and Investment Advisory Committee member of the GNMA, New Income, Global Multi-Sector Bond, QM U.S. Bond Index, and Short Duration Income Funds. Chris also is a member of the Mortgage-Backed Securities Multi-Sector Account Portfolio and Dynamic Credit Fund Investment Advisory Committees, a member of the Core/Core Plus Portfolio Strategy team, and a cochair of the Sector Strategy Advisory Group. Chris is a vice president of T. Rowe Price Group, Inc., and T. Rowe Price Associates, Inc.

Ramon de Castro is a portfolio manager in the Fixed Income Division. He manages and is a vice president of the GNMA Fund and manages the Mortgage-Backed Securities Multi-Sector Account Portfolio. Ramon also is a sector portfolio manager responsible for the agency and non-agency residential mortgage-backed securities (RMBS) sleeves of various multi-sector fixed income portfolios, and he is a member of the Money Market Credit Policy Committee. Ramon is a vice president of T. Rowe Price Group, Inc., and T. Rowe Price Associates, Inc.

Jean-Marc Breaux is a sector portfolio manager in the Fixed Income Division. He is a member of the Money Market Credit Policy Committee. He also is a member of the Investment Advisory Committees for the Short-Term Bond Fund, New Income Fund, and Total Return Fund. Jean-Marc is a vice president of T. Rowe Price Group, Inc., and T. Rowe Price Associates, Inc.