
May 2024 / MARKETS & ECONOMY
What factors are driving U.S. exceptionalism, and will they last?
U.S. economic growth has outperformed other developed markets, and inflation has been stickier.
Key Insights
- U.S. economic growth has outperformed and inflation has been stickier than that of other developed markets recently, leading to divergent monetary policy expectations.
- A slowdown in U.S. GDP and employment growth could lead to narrowing outperformance and congruent monetary policy paths.
- However, a strong labor market in the U.S., as well as fiscal and industrial policy, support longer-term divergence.
Economic growth in the U.S. has outperformed that of other developed markets recently. During 2023, U.S. gross domestic product (GDP) grew by 2.5%. At the same time, the Canadian economy expanded by less than half that pace, at 1.1%. The growth performance of the UK and euro area was even more lackluster by comparison.
Consumer and government spending support growth
The U.S. consumer has continued to drive growth, supported by a strong labor market. Job vacancies have remained high and labor turnover low as companies have held on to their workers after the extreme difficulties of hiring talent over the past two years. However, an underappreciated factor has been fiscal policy. Fiscal spending made up almost 30% of U.S. growth last year, with both federal- and state-level expenditures being quite punchy.
Consensus forecasts predict that the U.S. growth outperformance will continue over the medium term, driven by a similar cocktail of supportive private and government demand. The divergence with other economies is expected to moderate but remains notable, especially with respect to Europe.
Developed markets growth forecasts
(Fig. 1) U.S. growth forecasts exceed other developed markets
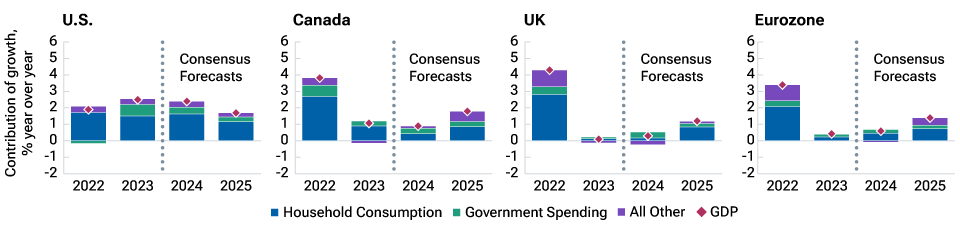
As of May 7, 2024.
As-of date reflects date of last update since Bloomberg consensus forecasts can change.
Stacked bars show contribution to GDP by each component.
Sources: Bureau of Economic Analysis (U.S.), Statistique Canada (Canada), Office of National Statistics (UK), Statistical Office of the European Communities (eurozone), Bloomberg Finance L.P. Analysis by T. Rowe Price.
Annual inflation in developed markets
(Fig. 2) U.S. core services inflation has been sticky
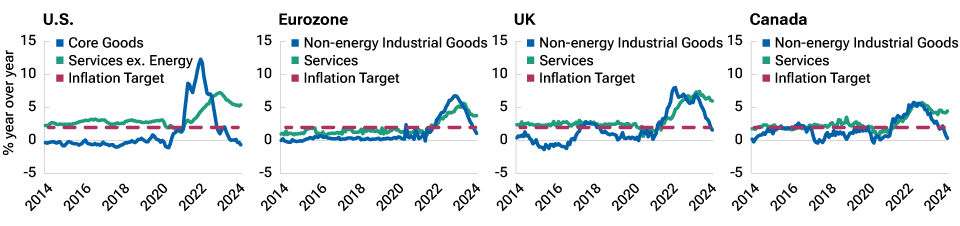
As of May 7, 2024.
Sources: Bureau of Labor Statistics (U.S), Eurostat (eurozone), Office for National Statistics (UK), Statistique Canada (Canada).
Inflation target = 2%.
Inflation lingering for longer
A corollary of growth outperformance has been slower progress on taming inflation than in other economies. While both core goods and services inflation have come down significantly from their peaks, core services components in the U.S. have been stubbornly sticky. Strong consumer demand has allowed firms to continue to pass on higher input costs while protecting profit margins. In addition, the rising cost of living has, to some extent, driven workers to successfully negotiate higher wages (recent union wage gains are a prime example) or quit for better prospects elsewhere. The result is strong aggregate wage growth, although the cumulative rise in wages since the pandemic continues to lag the rise in consumer prices.
Differing monetary policy expectations…
Driven by the divergences in both the growth and inflation outlooks, markets have priced very different monetary policy paths in the U.S. than elsewhere. The U.S. Federal Reserve is not expected to cut interest rates until the fourth quarter 2024, and the weighted probability of various interest rate paths points to fewer than two cuts for 2024. By comparison, markets expect the European Central Bank to start easing policy in June, the Bank of Canada in July, and the Bank of England in August. While some of these divergences may be justified by very recent data, the current market narrative hangs on a very fragile equilibrium.
Annual inflation in developed markets
(Fig. 3) Developed markets rates expected to decline, remain elevated
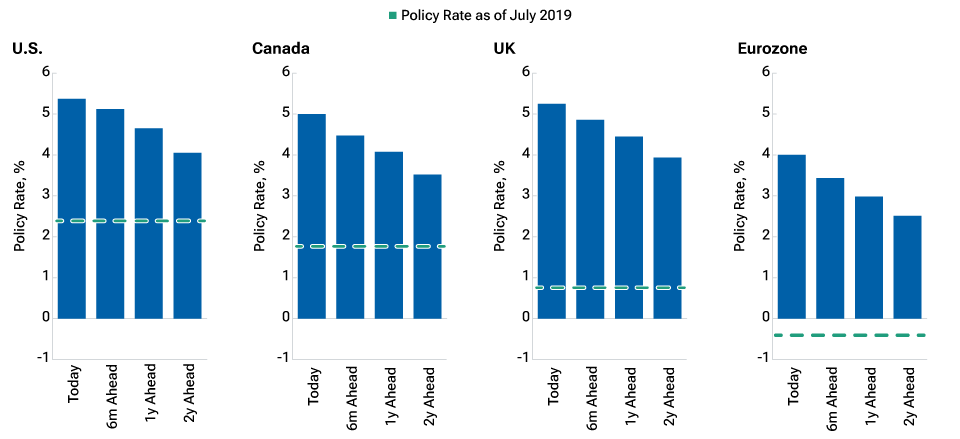
As of May 7, 2024. Actual outcomes may differ materially from forward estimates.
Source: Bloomberg Finance L.P.
Developed markets fiscal deficits
(Fig. 4) Larger U.S. fiscal deficits could support higher rates
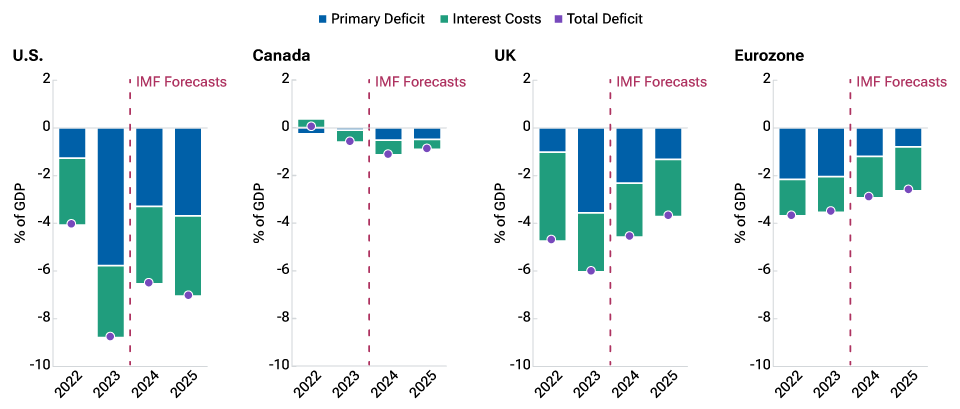
As of May 7, 2024. Actual outcomes may differ materially from forward estimates.
Source: IMF World Economic Outlook, April 2024.
…could change quickly
The recent slowing in U.S. GDP and employment growth suggests that the outperformance of the U.S. could taper off. It is also possible that U.S. data beyond employment growth may have been boosted by favorable seasonal elements in the first quarter—meaning that inflation may also moderate in the near term. This could quickly shift the market narrative toward a more dovish outcome for U.S. monetary policy, closing some of the market pricing divergence with other developed markets. It is also possible that the apparent stalling in U.S. inflation during the first quarter could play out in other economies later this year. The UK economy stands out as being a possible candidate of stickier services inflation given the tightness of the labor market in large part due to a lack of labor supply.
Markets may continue to price a shallower cutting path for the U.S., but there is a common factor across all four economies that is likely to persist. The predicted level of interest rates in two years’ time is significantly higher than the prevailing rates before the pandemic. Higher rates for longer has become the consensus, likely driven by a combination of resilient growth and stronger inflation in light of the sharp rise in interest rates since 2022. If this prediction is correct, central banks are less apt to be stuck at the zero lower bound in the next recession and could use balance sheet policy less enthusiastically.
Longer-term divergence could be here to stay
Over the medium term, U.S. exceptionalism appears likely to persist. Labor market dynamism driven by a recent rebound in the supply of prime wage workers will potentially be one factor. A positive labor supply side shock of this magnitude will likely pay dividends through stronger aggregate demand for both goods and services while alleviating some of the acute labor market bottlenecks that built up during the pandemic.
Another factor supporting the outlook for U.S. growth is the persistence of fiscal and industrial policy. The U.S. primary deficit as a share of GDP will be much larger according to International Monetary Fund (IMF) estimates. This combined with stronger investment growth and advancements in artificial intelligence (AI) could boost not only output, but also productivity, which has been disappointing in the U.S. for over a decade. While the market narrative in the near term may shift toward a less favorable tilt for the U.S. economy, over the medium term, U.S. growth appears set to be stronger than other developed markets for structural reasons, including strong labor supply and investment in tech manufacturing and green energy, as well as AI.
As a result, higher interest rates for longer are also likely to be not only appropriate, but also sustainable. A larger fiscal deficit may contribute to higher interest rates in the U.S. through increased term premia, as investors require greater compensation given heightened uncertainty around the outlook for future debt loads and inflation implied by large fiscal deficits.
Important Information
This material is being furnished for general informational and/or marketing purposes only. The material does not constitute or undertake to give advice of any nature, including fiduciary investment advice. Prospective investors are recommended to seek independent legal, financial and tax advice before making any investment decision. T. Rowe Price group of companies including T. Rowe Price Associates, Inc. and/or its affiliates receive revenue from T. Rowe Price investment products and services. Past performance is not a reliable indicator of future performance. The value of an investment and any income from it can go down as well as up. Investors may get back less than the amount invested.
The material does not constitute a distribution, an offer, an invitation, a personal or general recommendation or solicitation to sell or buy any securities in any jurisdiction or to conduct any particular investment activity. The material has not been reviewed by any regulatory authority in any jurisdiction.
Information and opinions presented have been obtained or derived from sources believed to be reliable and current; however, we cannot guarantee the sources’ accuracy or completeness. There is no guarantee that any forecasts made will come to pass. The views contained herein are as of the date written and are subject to change without notice; these views may differ from those of other T. Rowe Price group companies and/or associates. Under no circumstances should the material, in whole or in part, be copied or redistributed without consent from T. Rowe Price.
The material is not intended for use by persons in jurisdictions which prohibit or restrict the distribution of the material and in certain countries the material is provided upon specific request. It is not intended for distribution to retail investors in any jurisdiction.
Canada—Issued in Canada by T. Rowe Price (Canada), Inc. T. Rowe Price (Canada), Inc.’s investment management services are only available to Accredited Investors as defined under National Instrument 45-106. T. Rowe Price (Canada), Inc. enters into written delegation agreements with affiliates to provide investment management services.
© 2024 T. Rowe Price. All Rights Reserved. T. ROWE PRICE, INVEST WITH CONFIDENCE, and the Bighorn Sheep design are, collectively and/or apart, trademarks of T. Rowe Price Group, Inc.
May 2024 / FIXED INCOME

Blerina Uruçi is the chief U.S. economist in the Fixed Income Division. She contributes to the formulation of investment strategy and supports investment and client development activities throughout T. Rowe Price, specifically focusing on the outlook for the U.S. economy, inflation, and monetary policy. Blerina is a vice president of T. Rowe Price Group, Inc., and T. Rowe Price Associates, Inc.
