
June 2024 / RETIREMENT
A five-dimensional framework for retirement income needs and solutions
A new tool to help DC plan sponsors evaluate retirement income solutions for their participants.
Key Insights
- As more defined contribution plan sponsors consider implementing retirement income solutions, we think they can benefit from research that accounts for the trade‑offs inherent in such solutions.
- T. Rowe Price has developed an innovative five‑dimensional (5D) framework for understanding and quantifying the unique preferences and needs of retirement investors.
- Our patent-pending 5D framework offers a new method to help plan sponsors evaluate retirement income solutions for their participant populations.
Unlike the accumulation phase of retirement investing, during which most individuals share a common goal of saving as much as they can afford and growing those savings through investments such as target date funds or other diversified multi‑asset investment products, investors’ goals typically are more diverse during the decumulation phase. As more defined contribution (DC) plan sponsors evolve beyond exploring the landscape of available retirement income solutions to adopting an implementation‑oriented stance, we believe that the system could benefit from:
- Research that fully appreciates and accounts for the trade‑offs inherent in individual retirement income needs and solutions, and
- a common framework for evaluating retirement income solutions—guaranteed or non‑guaranteed—to help plan sponsors evaluate products for their participant populations.
To address this challenge, T. Rowe Price’s global multi‑asset research team, in partnership with our global retirement strategy team, has developed a patent-pending five‑dimensional (5D) framework for exploring retirement income needs and potential solutions. Our 5D framework establishes the foundational attributes of the “in‑retirement experience” for individual investors and quantifies the economic trade‑offs between these attributes.
Our unique approach starts with a simple assumption that every aspect of the in‑retirement experience is captured by at least one retirement income product currently available in the marketplace. By comprehensively reviewing the existing universe of retirement income solutions and analyzing the trade‑offs inherent in various product designs, we were able to identify five key attributes that are specific, mutually exclusive, and exhaustive, and that we believe fully characterize the in‑retirement experience (Figure 1).
The 5D framework
(Fig. 1) Key attributes of the in‑retirement experience
Attribute |
Definition |
Real‑Life Meaning |
|---|---|---|
Longevity risk hedge |
Portfolio duration/planning horizon |
How many years will my retirement savings last? |
Level of payments |
Income yield |
What will the amount of my annual income be? |
Volatility of payments |
Income volatility |
How much can my “paychecks” change from year to year? |
Liquidity of balance |
Asset liquidity |
If a need arises, how much of my savings can I access? |
Unexpected balance depletion |
Asset preservation |
How high is the risk of my money running out earlier than planned? |
Source: T. Rowe Price.
See Appendix and Additional Disclosure for more information.
Using these five attributes, we then analyzed various retirement income solutions to identify and articulate the trade‑offs inherent in each solution—such as understanding how a specific solution balanced the goal of hedging against longevity risk with the objective of achieving a desired level of income payments.
Our research revealed a parallel between our 5D framework and the traditional risk/return investment trade‑off. The 5D framework enabled us to conduct quantitative studies of retirement income solutions based on various well‑defined metrics, similar to how the risk/return trade‑off has been studied for decades.
A framework for evaluating retirement income solutions
While traditional metrics such as risk‑adjusted returns and the familiar mean‑variance frontier may suffice for traditional investments during the accumulation phase, plan sponsors and their consultants and advisors need a more sophisticated approach to evaluate retirement income solutions. Leveraging the five key attributes in Figure 1, we use our 5D approach to analyze how various retirement income solutions prioritize these five aspects of the in‑retirement experience.
We believe our 5D approach better captures the diverse needs and preferences of retiree populations and, importantly, quantifies the relationships between these preferences. For example, in the accumulation phase, investors primarily seek to achieve the highest return possible for a given risk budget, which typically grows more conservative as they near retirement age. During decumulation, risk and return are still important metrics but fall short of fully representing investors’ objectives at the point of retirement, which tend to be more varied and unique to each individual.
Because the in‑retirement experience includes these five attributes, potential solutions must be optimized against five dimensions instead of the traditional two—risk and return—that dominate the accumulation phase (Figure 2).
Evaluation of traditional investments vs. retirement income solutions
(Fig. 2) Hypothetical examples of two‑dimensional and five‑dimensional frameworks

Source: T. Rowe Price. For illustrative purposes only. Not representative of an actual investment.
See Appendix and Additional Disclosure for more information.
Furthermore, we must account for how the five attributes influence one another, as opposed to simply understanding how risk and return are related. For example, to hedge against longevity risk, an investor may need to deprioritize balance liquidity. Similarly, to achieve a higher level of payments, greater risk may need to be introduced, which, in turn, increases the likelihood of unexpected balance depletion. To gain any additional performance on one factor, an investor may need to sacrifice benefits elsewhere.
How does our 5D approach differ from existing retirement income frameworks?
In addition to establishing the five key attributes by which a retirement income solution can be evaluated, our 5D framework captures and quantifies the trade‑offs that a retiree must make in prioritizing certain of these attributes. Much of the retirement income research conducted to date has focused on identifying retired participant preferences, e.g., “I want a guaranteed stream of income,” but has failed to consider the other side of the ledger, e.g., “I am willing to give up X% in monthly income to achieve that goal.”
Under the financial market efficient frontier, our 5D framework quantifies retirement income needs by precisely calibrating trade‑offs between the five attributes and assigning quantitative values to each of those attributes based on well‑defined metrics. Quantifying participant needs for each of the five attributes allows us to identify how participants would spend their savings to create desired in‑retirement experiences.
Using a radar chart (a way of displaying multivariate data on an axis with the same central point), we can quantify and visualize these trade‑offs.
For example, consider the radar charts in Figure 3. The left chart represents one possible hypothetical preference profile for the in‑retirement experience. A retiree with this preference shape is primarily concerned about hedging against longevity risk—perhaps because of a family history of great health—and wants guaranteed income for life. This hypothetical retiree also prefers a stable income stream to allow for better travel planning in retirement, but wants a higher income level (measured as a percentage of balance) to compensate for past undersaving.
Using the 5D framework to illustrate investor preferences for the in‑retirement experience
(Fig. 3) Visualization of hypothetical sample preferences

Source: T. Rowe Price. For illustrative purposes only. Not representative of an actual investment.
See Appendix and Additional Disclosure for more information.
Given these priorities, the retiree is willing to accept a moderate level of balance depletion risk while giving up some liquidities under the efficient frontier constraint. As one can imagine, preference profiles for different retirees can and do vary widely because of differing in‑retirement needs. Because preferences can change across all five dimensions, the range of desired in‑retirement experiences can be immensely diverse.
Figure 3 also highlights the difference between our 5D framework and those retirement income studies that fail to consider the trade‑offs inherent in retirement income products. There will be only one preference profile in such studies—a perfect pentagon in which maximum values for all five attributes are selected (as shown in the radar chart on the right in Figure 3) without acknowledging that it is impossible to attain all five under the efficient frontier.
T. Rowe Price’s proprietary 2024 study of approximately 2,500 individual investors shed light on how investors, as a group, actually prioritized each of the five in‑retirement attributes. 1As illustrated in Figure 4, the data indicated that individuals who were approaching or in retirement were most concerned about how many years their savings would last (longevity risk), followed by the risk that they might run out of money earlier than expected (unexpected balance depletion). Level of payments and liquidity of balance were assigned equal importance, while volatility of payments was viewed as the least important attribute by the investors surveyed.
Retirement income preferences among DC plan participants
(Fig. 4) Relative importance scores for preference attributes

Data do not add to 100% because of rounding.
Source: T. Rowe Price, 2024 Exploring Individuals’ Retirement Income Needs and Preferences.See Appendix and Additional Disclosure for more information.
Potential applications of our 5D framework for plan sponsors
Once a plan sponsor understands the distribution of preferences within their participant population—whether that’s based on a participant survey or a qualitative review that prioritizes the five attributes—we think they will be better positioned to identify potential solutions that prioritize the needs of that population.
Similarly, retirement income products can be plotted using our 5D framework to visualize which products appear to align best with the plan’s retirement income priorities (Figure 5). Notably, the 5D framework provides an opportunity to compare different retirement income products using a uniform and unbiased process, much like mean‑variance optimization can be used to compare products suited for traditional investments. The 5D framework shows how a retirement income product scores across each of the five attributes, and this output can then be compared with the same output for another product.
Using the 5D framework to compare retirement income solutions
(Fig. 5) Hypothetical solutions with attribute scores
Source: T. Rowe Price. For illustrative purposes only. Not representative of an actual investment. This analysis contains information derived from a Monte Carlo simulation. This is not intended to be investment advice or a recommendation to take any particular investment action. See Appendix and Additional Disclosure for important information.
Plan sponsors, in partnership with their consultants or advisors, can compare the findings of a 5D analysis and the specific retirement income needs of their participant populations to identify “best fit” solutions. Any retirement income solution can be analyzed using our 5D framework under a commonly accepted set of capital market assumptions to understand and quantify how well the product meets each of the key attributes.
Time to put on your 5D glasses for a hypothetical case study
The following hypothetical case study offers an example of how a plan sponsor can use our 5D framework to better understand the unique preferences of their participant population and identify potential retirement income solutions that align with these needs.2
Who?
- A large health care company with a USD 10 billion 401(k) plan offered to approximately 150,000 employees ranging from hourly paid workers to highly compensated salaried professionals.3
- The employer matches 100% of the first 5% of an employee’s pay contributed to the 401(k) plan.
- The plan has a large female population.
Why?
- The employer prefers that retired employees keep their balances in the 401(k) plan, based on a belief that participants can benefit from the plan’s institutional pricing and the ongoing fiduciary oversight provided by plan fiduciaries.
- The plan already offers a managed account service and has revisited the plan’s distribution options to include flexible access to retirement savings (ad hoc withdrawals and systematic withdrawal payments both are available)
- To support their objective of retaining retirees in the plan, the employer wants to add one or more in‑plan retirement income solutions.
What? (What are the participants’ needs?)
- Using our 5D framework and participant population demographic data from the recordkeeper, the plan identifies large cohorts of participants based on their anticipated needs in retirement.
How?
Step 1: Demand Analysis
We built a probabilistic model to assess the demand for various retirement income solutions within the hypothetical plan’s participant population. This enabled us to understand how plan participants were likely to assign value across the five attributes in the 5D framework. In the process, we discovered that the male and female cohorts within the plan population had their own distinct preferences (Figure 6).
Relative importance scores for retirement income attributes
(Fig. 6) Female and male plan participant cohorts

Source: T. Rowe Price. As the case study is a hypothetical plan, the information presented here is based on our 2024 Exploring Individuals’ Retirement Income Needs and Preferences survey. We are using these statistics to represent the hypothetical plan population.
Step 2: Participant Acceptance Analysis
We tested how many participants would accept the retirement income products included in the two approaches being considered by our hypothetical plan sponsor: Approach A and Approach B (Figure 7).
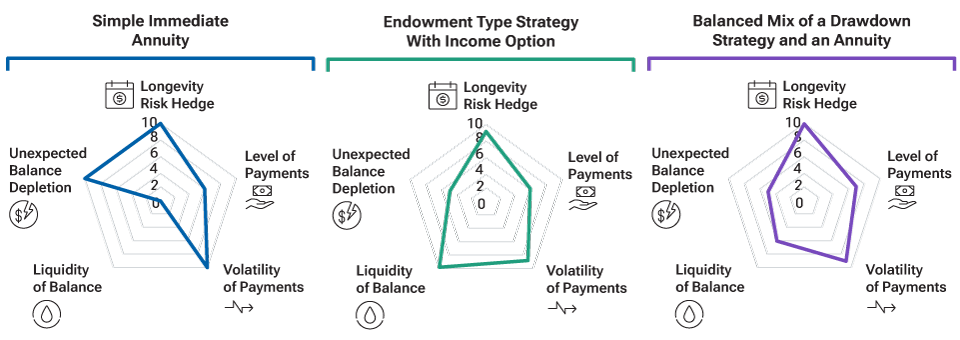
- Approach A consisted of two retirement income products: an endowment‑type strategy with an income option and a balanced mix of a drawdown strategy and an annuity.
- Approach B consisted of a single product: an endowment‑type strategy with an income option. (Note that an endowment‑type strategy with an income option is typically the final vintage in a target date series.)
Coverage ratios for two hypothetical retirement solutions
(Fig. 7) Percent of participants who would accept the product

Data for Approach A do not add to 100% because of rounding.Source: T. Rowe Price. For illustrative purposes only. Not representative of an actual investment. This analysis contains information derived from a Monte Carlo simulation. This is not intended to be investment advice or a recommendation to take any particular investment action. See Appendix and Additional Disclosure for important information.
Using our probabilistic model, we calculated a “coverage ratio” for each approach—defined as the percentage of participants that would accept the retirement income product or products included in the approach. As shown in Figure 7, we found that 77.2% of participants would accept at least one product from Approach A, while only 64.1% were willing to accept the single product offered in Approach B.
More importantly, the single product offered in Approach B—an endowment‑type strategy with an income option—was identical to the endowment‑type strategy in Approach A. However, when offered alongside a balanced mix of a drawdown strategy and an annuity (as in Approach A), the acceptance rate for an endowment‑type strategy dropped from 64.1% to 23.6%.
This suggests that the majority of participants among the 64.1% who said yes to the endowment‑type strategy in Approach B could have found a better match for their needs if that approach had also included an additional retirement income solution.
From this, we can conclude that Approach A potentially would be more appropriate for our hypothetical plan population than Approach B. This conclusion is based on two aspects:
- The products in Approach A collectively covered a higher percentage of the population, which meant more participants had a retirement income product they were willing to use.
- There were more products in Approach A, which meant it could generate more in‑retirement experience profiles, i.e., shapes on a radar chart, with different combinations of the two products. As a result, more participants in our hypothetical plan population could have found a closer match with their own preferences.
Step 3: Efficiency Analysis
The last step in our analysis was to check the efficiency of each product in the selected approach. Monte Carlo simulation‑based analysis was conducted to check whether each product could deliver the best possible in‑retirement experience for the hypothetical plan’s participants while still meeting its mandate.
For example, the two hypothetical endowment‑type strategies with income options mapped on the radar chart in Figure 8 were similarly oriented in terms of providing strong liquidity, managing the volatility of payments, and hedging longevity risk. However, the option represented by the blue line scored slightly higher on each attribute and was, therefore, the more efficient product to offer participants.
Comparing efficient vs. inefficient retirement income products
(Fig. 8) Attribute scores for hypothetical payout approaches

Source: T. Rowe Price. For illustrative purposes only. Not representative of an actual investment. This analysis contains information derived from a Monte Carlo simulation. This is not intended to be investment advice or a recommendation to take any particular investment action. See Appendix and Additional Disclosure for important information.
From Step 2, we know that an endowment‑type strategy with an income option appeals to a large portion of the plan’s participants. Step 3, then, enables us to hypothetically identify the most efficient product within that category of retirement income solutions.
Concluding thoughts
We believe our 5D framework is a novel approach that offers plan sponsors the ability to better understand the unique preferences of their plan participants, enabling them to narrow the retirement income product universe to the solutions that are most likely to meet the needs of their unique populations.
Let’s continue the discussion.
Contact your T. Rowe Price representative to learn more about applying our 5D approach to your evaluation of retirement income solutions.
Appendix: Study Methodologies
The methodologies used in this study included theoretical economic tradeoff analysis, Monte Carlo simulation‑based quantitative investment analysis, and classic quantitative marketing research methods.
Key Evaluation Metrics
For participant acceptance:
- Coverag ratio of an approach to retirement income solutions: percentage of participants in the plan that are willing to accept at least one product in the approach as their retirement income solution.
- Number of products: number of retirement income products in each approach.
- Acceptance rates for the same products in different approach: percentage of participants in the plan that are willing to accept the same product when offered in different approaches.
- Relative importance scores: the proportional impact that each attribute had on a respondent’s choices. For example, in Figure 6, on average, men and women would rank longevity risk hedge as more important than the other attributes provided in the study. However, where they differed was for unexpected balance depletion, which was ranked as more important by females than males. The importance score is a relative measurement, so the sum of the impacts from all five attributes is normalized to 100% and the results are expressed as percentages.
For efficiency:
- The set of metrics for the five attributes.
- The metric set varied from a basic set (as illustrated in Fig. 1) to more comprehensive sets with multiple metrics for each attribute.
- All five attributes were evaluated jointly to make efficiency determinations, based on the more efficient definition.
Important Information
This material is being furnished for general informational and/or marketing purposes only. The material does not constitute or undertake to give advice of any nature, including fiduciary investment advice. Prospective investors are recommended to seek independent legal, financial and tax advice before making any investment decision. T. Rowe Price group of companies including T. Rowe Price Associates, Inc. and/or its affiliates receive revenue from T. Rowe Price investment products and services. Past performance is not a reliable indicator of future performance. The value of an investment and any income from it can go down as well as up. Investors may get back less than the amount invested.
The material does not constitute a distribution, an offer, an invitation, a personal or general recommendation or solicitation to sell or buy any securities in any jurisdiction or to conduct any particular investment activity. The material has not been reviewed by any regulatory authority in any jurisdiction.
Information and opinions presented have been obtained or derived from sources believed to be reliable and current; however, we cannot guarantee the sources’ accuracy or completeness. There is no guarantee that any forecasts made will come to pass. The views contained herein are as of the date written and are subject to change without notice; these views may differ from those of other T. Rowe Price group companies and/or associates. Under no circumstances should the material, in whole or in part, be copied or redistributed without consent from T. Rowe Price.
The material is not intended for use by persons in jurisdictions which prohibit or restrict the distribution of the material and in certain countries the material is provided upon specific request. It is not intended for distribution to retail investors in any jurisdiction.
Canada—Issued in Canada by T. Rowe Price (Canada), Inc. T. Rowe Price (Canada), Inc.’s investment management services are only available to Accredited Investors as defined under National Instrument 45-106. T. Rowe Price (Canada), Inc. enters into written delegation agreements with affiliates to provide investment management services.
© 2024 T. Rowe Price. All Rights Reserved. T. ROWE PRICE, INVEST WITH CONFIDENCE, and the Bighorn Sheep design are, collectively and/or apart, trademarks of T. Rowe Price Group, Inc.

Berg Cui is a senior quantitative investment analyst in the Multi-Asset Division.

Jessica Sclafani is a global retirement strategist for the Global Retirement Strategy team. The team leads an enterprise retirement strategy, advises on new product development, and helps amplify the firm’s voice in retirement policy and thought leadership domains. Jessica is responsible for authoring original thought leadership that is designed to support the retirement objectives of retirement plan sponsors, consultants, and intermediaries in the U.S. and around the world. She is a vice president of T. Rowe Price Group, Inc., and T. Rowe Price Associates, Inc.