
Choose your location
Asia Regional
English
Austria
Belgium
Denmark
Estonia
Finland
France
Iceland
Ireland
Italy
Latvia
Lithuania
Luxembourg
Netherlands
Norway
Portugal
Spain
Sweden
Switzerland
United Kingdom
 2024 Global Market Outlook Midyear Update
How central bank policy could impact your portfolio
At midyear, expectations for rate cuts have been pushed out further, with far fewer anticipated, and markets have repriced accordingly. We anticipate growth in the global economy. We see continued market broadening, with select equity and fixed income opportunities. Most importantly, we believe the ongoing transition from the low-rate post-GFC environment to one characterised by higher interest rates may provide favorable conditions for active managers to outperform.
Key factors shaping our midyear outlook
Interest rates
Higher for longer has become the consensus
Most developed market central banks are walking a tightrope amid reaccelerating inflation. Our view is that the U.S. Federal Reserve (Fed) is likely to make fewer cuts, while we believe the European Central Bank will cut between 1–3 times. We expect Japan to gradually tighten its monetary policy.
Key takeaway
The Fed is more likely to surprise with fewer cuts than with more.
Inflation
Energy stocks and commodities could help hedge against inflation
Energy sector stocks have historically performed quite well during periods of very high inflation. This suggests that one way to hedge against inflation risk would be to tilt portfolios toward stocks in the energy sector and other commodity-oriented equities.
Key takeaway
Sticky inflation could inflect higher as global growth broadens. Commodity-oriented equities may offer an effective way to navigate inflation risk.
U.S. equities
Opportunities broaden beyond the “Magnificent Seven”
We believe artificial intelligence will create long-term winners, but stock selection is key as performance of the mega-cap tech stocks begins to fragment. We anticipate a continued expansion of opportunities and believe that value—and possibly small-cap—stocks may begin to challenge the dominance of large-cap growth stocks.
Key takeaway
Now may be the time to diversify into areas that have valuation support and robust fundamentals, such as value stocks.
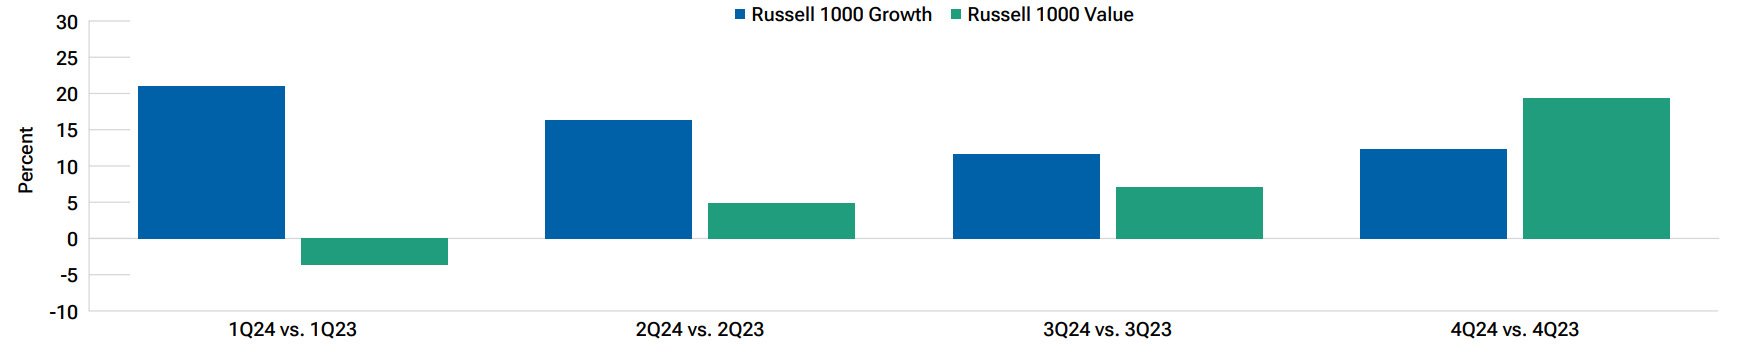
Value stocks look poised for earnings resurgence
Estimated earnings per share of value stocks set to outstrip growth stocks later this year
As of May 13, 2024
Source: FTSE Russell
Actual outcomes may differ materially from estimates. Each time period shows the estimated year-over-year change in quarterly earnings for growth and value stocks for each quarter this year.
International equities
Rising capital expenditure should benefit value sectors
Rising capital expenditure should benefit value sectors
In contrast to the U.S. market’s heavy exposure to growth stocks, the international market is more exposed to value-oriented sectors, including financials, materials, industrials, and energy. Supply chain diversification, infrastructure rebuild, defense spending, and the likelihood of higher energy prices should favor traditional value sectors as capital spending accelerates.
Key takeaway
We continue to favor Japan and see select opportunities in emerging markets, such as South Korea and Vietnam.
Fixed Income
Uncertain environment favors short duration bonds
Uncertain environment favors short duration bonds
Short-term bonds are highly valued during uncertain periods—such as the present—because they are less exposed to interest rate changes than longer-maturity bonds. They also provide the potential for higher returns than cash while being almost as liquid, which can be useful during periods of economic uncertainty.
Key takeaway
We have a preference for short duration bonds. While credit spreads are tight, we are currently overweight high yield and emerging market debt.
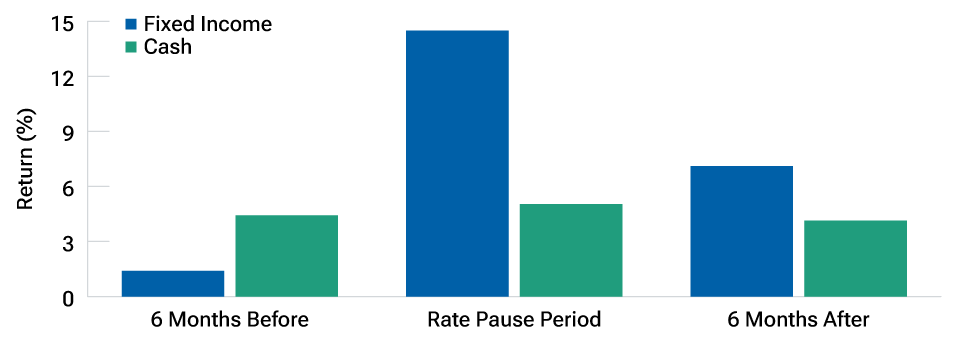
Bonds have tended to outperform cash during rate pause periods
As of April 30, 2024.
Past performance is not a reliable indicator of future performance. For illustrative purposes only.
This is not representative of actual investments and does not reflect any fees and expenses associated with investing. Indexes cannot be invested in directly. Cash is represented by the Bloomberg U.S. Treasury Bills 1-3 Month Index, and bonds is represented by the Bloomberg U.S. Aggregate Bond Index. Historical average performance in the 6 months leading up to the last Federal Reserve rate hike, the rate pause period (between the last rate hike and first cut), and the 6 months after the first cut. Dates used for the last rate hike of a cycle are: 02/01/1995, 03/25/1997, 05/16/2000, 06/29/2006. Dates used for the first rate cut are: 07/06/1995, 09/29/1998, 09/18/2007, 08/01/2019.
Source: Bloomberg Finance L.P. Data analysis by T. Rowe Price.

We put our clients at the center of our best thinking.
Our insights show you what’s ahead, what’s most important, and how our investment teams are responding now - so you have the full picture.
Important Information
Where securities are mentioned, the specific securities identified and described are for informational purposes only and do not represent recommendations.
This website is being furnished for general informational purposes only. The website does not constitute or undertake to give advice of any nature, including fiduciary investment advice, nor is it intended to serve as the primary basis for an investment decision. Prospective investors are recommended to seek independent legal, financial and tax advice before making any investment decision. T. Rowe Price group of companies including T. Rowe Price Associates, Inc. and/or its affiliates receive revenue from T. Rowe Price investment products and services. Past performance is not a reliable indicator of future performance. The value of an investment and any income from it can go down as well as up. Investors may get back less than the amount invested.
The website does not constitute a distribution, an offer, an invitation, a personal or general recommendation or solicitation to sell or buy any securities in any jurisdiction or to conduct any particular investment activity. The website has not been reviewed by any regulatory authority in any jurisdiction.
Information and opinions presented have been obtained or derived from sources believed to be reliable and current; however, we cannot guarantee the sources' accuracy or completeness. There is no guarantee that any forecasts made will come to pass. The views contained herein are as of the date written and are subject to change without notice; these views may differ from those of other T. Rowe Price group companies and/or associates. Under no circumstances should the material, in whole or in part, be copied or redistributed without consent from T. Rowe Price.
202407-3666927