
July 2024 / EQUITY
Integrated Equity Insights: Measuring equity market sensitivity to interest rate changes
Measuring Equity Market Sensitivity to Interest Rate Changes
The second quarter of 2024 was marked by continued U.S. mega‑cap growth leadership, mixed economic data that appear generally supportive of declining inflation and a healthy economy (“no landing” or “soft landing”), and the start of interest rate cuts abroad, especially in Europe. We highlight three themes:
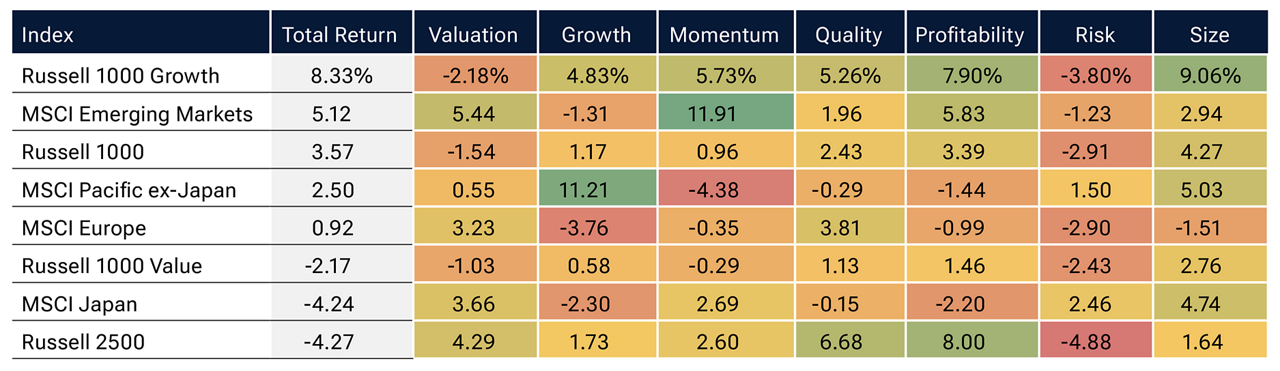
- Continued U.S. mega‑cap growth leadership: The Russell 1000 Growth Index continued to lead broad global markets (Figure 1), reflecting extremely strong company fundamentals and ongoing investor interest in artificial intelligence (AI). The leaders this quarter continued to be the large, high‑quality, high‑profitability firms that have had strong momentum over the past year.
Quarterly factor returns
(Fig. 1) April 1, 2024–June 30, 2024
Past performance is not a reliable indicator of future performance.
Sources: Refinitiv/IDC data, Compustat, Worldscope, Russell, MSCI. Analysis by T. Rowe Price. See Additional Disclosures. Total return data are in U.S. dollars. Factor returns are calculated as equal‑weighted quintile spreads. Please see Appendix for more details on the factors.
- Continued narrowness in the U.S. market: In contrast to the Russell 1000 Growth Index outperformance of other market segments, the Russell 1000 Value and Russell 2500 indices produced negative returns and underperformed large‑cap U.S. growth stocks this quarter. This reflects a historically narrow market, as well as concerns that any potential softening in economic conditions could disproportionately affect value‑oriented and smaller‑cap stocks.
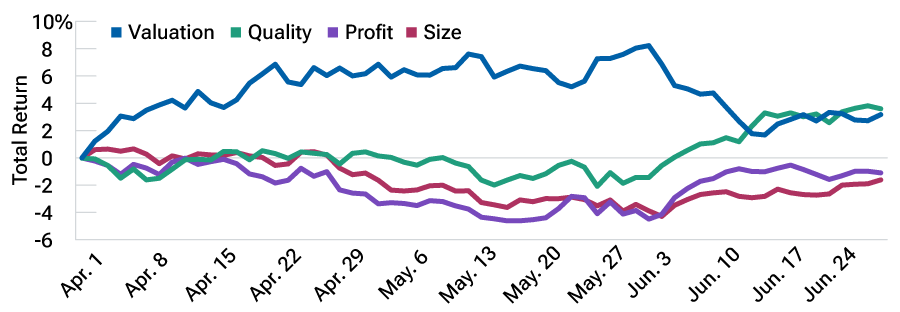
- European rate cuts significantly altered factor performance: While the U.S. Federal Reserve has not cut rates yet, the European Central Bank (ECB) started cutting rates on June 6. We believe rate cuts will be coming globally at different frequencies, and it will be instructive to observe how these markets react. In Europe, there was an unmistakable rotation from value stocks into high‑quality stocks following the ECB rate cut (Figure 2). This reflects concern that falling inflation could be a sign of economic weakness, triggering a flight to quality that was exacerbated throughout June by political instability in France and potential implications for Europe more broadly.
European factor performance
(Fig. 2) April 1, 2024–June 30, 2024
Past performance is not a reliable indicator of future performance.
Sources: Refinitiv/IDC data, Worldscope, MSCI. Analysis by T. Rowe Price. See Additional Disclosures. Total return data are in U.S. dollars. Factor returns are calculated as equal‑weighted quintile spreads. Please see Appendix for more details on the factors.
Market insight—What we’re monitoring
In this quarter’s newsletter, the Integrated Equity team discusses a critical element of portfolio construction: building resilient portfolios that manage emerging risks often ignored by risk models. Traditional risk models capture easily defined characteristics, such as size, value, or momentum, based on historical data. Factors like pandemic sensitivity or artificial intelligence exposure are not typically included in historical risk models. While earnings growth and other fundamental factors—rather than macro factors—should drive stock returns over a very long time frame, interest rates and macro factors are among the most determinant drivers of returns in today’s environment, as they are impacting the relative valuation of different cohorts of stocks. We have developed tools to evaluate more nuanced custom risk measures, and in this quarter’s newsletter, we explain a process for integrating interest rate risk into the portfolio risk measurement process.
Interest rates: Changes in long‑term rates impact stock valuations, as stock prices reflect the present value of expected future cash flows. While the Fed explicitly controls the short end of the yield curve, longer‑term rates have been moving in response to changes in inflation and the market’s expectations of growth and interest rates in the future. In our fourth‑quarter 2022 newsletter, we discussed the risk that rising rates posed to longer‑duration growth stocks. As long‑term rates rose in 2022, growth stocks, whose cash flows are farthest in the future, sold off the most. Today we see a potentially different situation.
We have hypothesized that since the start of the Fed’s tightening cycle, interest rate sensitivity is elevated compared with prior periods. In this quarter’s newsletter, we describe our development of an interest rate risk factor used to measure and assess stock and portfolio risk and highlight two key observations:
- The market’s sensitivity to interest rate changes is indeed elevated and at an extreme in the small‑cap universe
- Small‑cap low‑momentum stocks (laggards) are historically correlated with rising interest rate changes
Interest rate factor construction
As noted above, changes in long‑term rates are most impactful for stock valuations, as stock prices reflect the present value of expected future cash flows. To measure interest rate sensitivity, we calculated the rolling three‑year monthly correlation of each Russell 3000 Index stock’s return to changes in the Bloomberg U.S. Long Treasury Total Return Index Value Unhedged. We then validated the results to make sure our exposures were intuitively logical.
Two key insights
We observe two key findings from our interest rate factor:
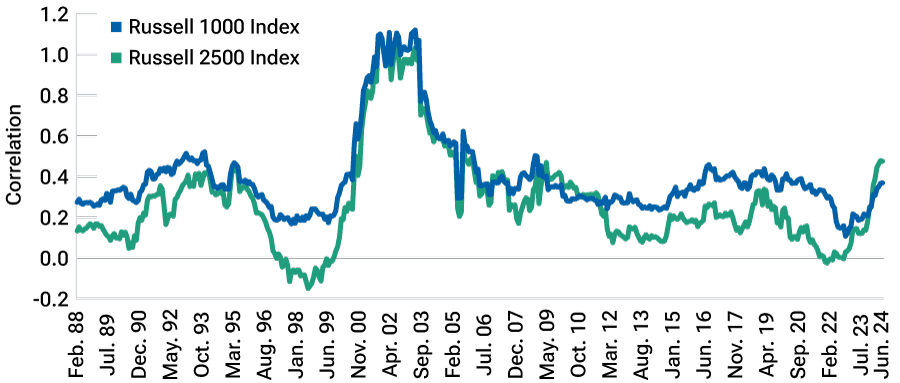
(1) The influence of interest rates on stock returns is currently elevated and extreme in small‑caps. Figure 3 shows the interest rate sensitivity through time for the most rate-sensitive cohorts of the large‑cap Russell 1000 Index and the small‑ to mid‑cap Russell 2500 Index; for interpretation, a positive correlation means that stocks benefit from falling rates (bond prices rising). While the correlation has historically been mostly positive over the 1988–2024 period, in smaller‑caps it is higher than at any point except the tech bubble era. This reflects the outsized impact the Fed’s hiking cycle has had on stocks of smaller companies, which tend to be longer duration and tend to have higher costs of capital alongside more floating rate debt. In contrast, rate sensitivity in large‑caps is not elevated, which we attribute to the much higher profitability of large‑cap companies today compared with history. Not only have margins steadily increased, but balance sheets are also healthy. Those companies that do have debt generally refinanced at low rates before the Fed started hiking.
Small‑caps’ interest rate sensitivity is at an extreme
(Fig. 3) February 29, 1988–June 30, 2024
Past performance is not a reliable indicator of future performance.
Sources: Bloomberg, FactSet, Refinitiv/IDC, Russell. Analysis, which is by T. Rowe Price, shows the 75th percentile (i.e., the most rate‑sensitive cohort) of rate sensitivity. Calculated as a rolling 3‑year correlation of monthly excess returns to changes in the Bloomberg U.S. Long Treasury Total Return Index Value Unhedged. Excess returns are returns relative to those of the corresponding Russell index. For the Russell 1000 Index (blue line), they are stock level returns relative to the Russell 1000 Index total return. For the Russell 2500 Index (green line), they are stock level returns relative to the Russell 2500 Index total return.
Today’s higher interest rate sensitivity in small‑caps has two implications: First, small‑caps as a whole were more challenged as interest rates rose, and second, if rates fall, they could be poised to rally. However, we note that it matters why rates fall and will address this later.
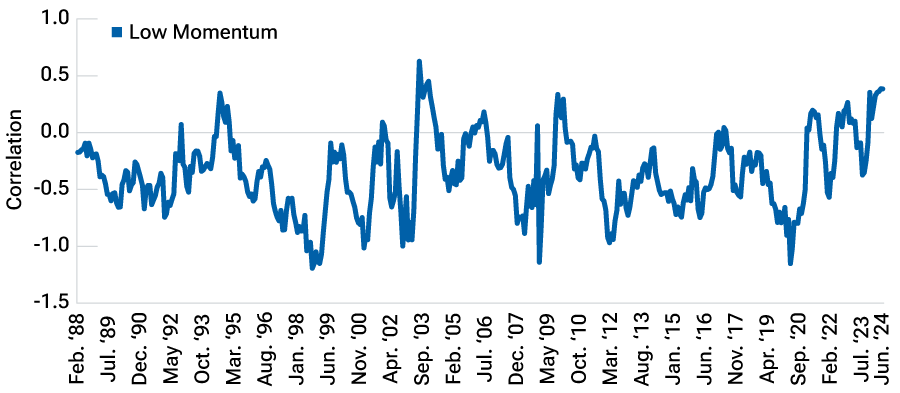
(2) Small‑cap low‑momentum stocks (laggards) are historically correlated to rising interest rate changes (Figure 4). The rate correlation of the lowest quintile of momentum (a subset of the entire small-cap universe) has typically been negative (i.e., they underperform when bond prices rise or interest rates fall). Currently, the correlation is positive, at levels only reached three previous times in the last four decades. This implies that, if rates fall, the worst‑performing small‑cap stocks in the recent past could rally significantly.
Small‑cap low‑momentum stocks currently have extreme rate sensitivity
(Fig. 4) February 29, 1988–June 30, 2024
Past performance is not a reliable indicator of future performance.
Sources: Bloomberg, FactSet, Refinitiv/IDC, Russell. Analysis by T. Rowe Price. The graph shows the rolling correlation of the lowest quintile of 9‑month momentum in the Russell 2500 Index to changes in the Bloomberg U.S. Long Treasury Total Return Index Value Unhedged.
Based on this analysis, falling long‑term rates could benefit small‑caps disproportionately, especially the laggards. Digging deeper into the low‑momentum group, we identified three groups of stocks:
- Defensive stocks—Traditional defensive names in certain sectors, such as utilities, that have generally benefited from falling rates in a risk‑off environment.
- Long duration growth—These stocks have cash flows farther in the future and, therefore, would benefit from a lower discount rate.
- Levered companies with weak balance sheets—Rising rates have both increased interest costs and reduced funding availability for this group of companies, applying further pressure to already weaker business models.
Practical implications for investors
Our research and analysis lead our team to favor quality stocks, which outperformed during the Fed’s most recent tightening cycle (2022–2023). We also believe stocks with positive fundamentals and stock price momentum look attractive and should be successful over the long term.
Looking ahead to when rates fall, which stocks perform well could depend on why rates are falling. If rates fall because economic growth slows and investors are concerned about a recession, we would expect defensive stocks to do well. However, if rates fall because inflation falls naturally (such as in a soft landing for the economy) and allows a preemptive Fed rate cut, we would expect long duration growth and levered companies, as noted on the previous page, to outperform.
Summary and conclusion
In conclusion, interest rate sensitivity, which is not captured by traditional risk models, is elevated and at a historical extreme in small‑caps. Investors who want to build resilient portfolios should ensure that the risks they take are intentional and scaled appropriately. Given the current environment’s extreme rate sensitivity and our acknowledgment that we can’t forecast future rate moves and their reasons, we believe employing the interest rate factor and the further decomposition into three categories to manage interest rate exposures and consequent risk from rate movements could be beneficial.
Appendix
Factors are our internally constructed metrics defined as follows:
Valuation: Proprietary composite of valuation metrics based on earnings, sales, book value, and dividends. Specific value factor weighting may vary by region and sector.
Growth: Proprietary composite of growth metrics based on historical and forward‑looking earnings and sales growth. Factor selection and weighting vary by region and industry.
Momentum: Proprietary measure of medium‑term price momentum.
Quality: Proprietary measure of quality based on fundamental and stock price stability, balance sheet strength, various measures of profitability, capital usage, and earnings quality.
Profitability: Return on equity.
Risk: Proprietary composite capturing stock return stability over multiple time horizons (positive return means risky stocks outperform stable stocks).
Size: Market capitalization (positive return means larger stocks outperform smaller stocks).
Additional Disclosure
© 2024 Refinitiv. All rights reserved.
MSCI and its affiliates and third party sources and providers (collectively, “MSCI”) makes no express or implied warranties or representations and shall have no liability whatsoever with respect to any MSCI data contained herein. The MSCI data may not be further redistributed or used as a basis for other indices or any securities or financial products. This report is not approved, reviewed, or produced by MSCI. Historical MSCI data and analysis should not be taken as an indication or guarantee of any future performance analysis, forecast or prediction. None of the MSCI data is intended to constitute investment advice or a recommendation to make (or refrain from making) any kind of investment decision and may not be relied on as such.
London Stock Exchange Group plc and its group undertakings (collectively, the “LSE Group”). © LSE Group 2024. FTSE Russell is a trading name of certain of the LSE Group companies. Russell® is a trade mark of the relevant LSE Group companies and is/are used by any other LSE Group company under license. All rights in the FTSE Russell indexes or data vest in the relevant LSE Group company which owns the index or the data. Neither LSE Group nor its licensors accept any liability for any errors or omissions in the indexes or data and no party may rely on any indexes or data contained in this communication. No further distribution of data from the LSE Group is permitted without the relevant LSE Group company’s express written consent. The LSE Group does not promote, sponsor or endorse the content of this communication. The LSE Group is not responsible for the formatting or configuration of this material or for any inaccuracy in T. Rowe Price’s presentation thereof.
Copyright © 2024, S&P Global Market Intelligence (and its affiliates, as applicable). Reproduction of any information, data or material, including ratings (“Content”) in any form is prohibited except with the prior written permission of the relevant party. Such party, its affiliates and suppliers (“Content Providers”) do not guarantee the accuracy, adequacy, completeness, timeliness or availability of any Content and are not responsible for any errors or omissions (negligent or otherwise), regardless of the cause, or for the results obtained from the use of such Content. In no event shall Content Providers be liable for any damages, costs, expenses, legal fees, or losses (including lost income or lost profit and opportunity costs) in connection with any use of the Content. A reference to a particular investment or security, a rating or any observation concerning an investment that is part of the Content is not a recommendation to buy, sell or hold such investment or security, does not address the suitability of an investment or security and should not be relied on as investment advice. Credit ratings are statements of opinions and are not statements of fact.
T. Rowe Price calculations using data from FactSet Research Systems Inc. All rights reserved.
IMPORTANT INFORMATION
This material is being furnished for general informational and/or marketing purposes only. The material does not constitute or undertake to give advice of any nature, including fiduciary investment advice, nor is it intended to serve as the primary basis for an investment decision. Prospective investors are recommended to seek independent legal, financial and tax advice before making any investment decision. T. Rowe Price group of companies including T. Rowe Price Associates, Inc. and/or its affiliates receive revenue from T. Rowe Price investment products and services. Past performance is not a reliable indicator of future performance. The value of an investment and any income from it can go down as well as up. Investors may get back less than the amount invested.
The material does not constitute a distribution, an offer, an invitation, a personal or general recommendation or solicitation to sell or buy any securities in any jurisdiction or to conduct any particular investment activity. The material has not been reviewed by any regulatory authority in any jurisdiction.
Information and opinions presented have been obtained or derived from sources believed to be reliable and current; however, we cannot guarantee the sources’ accuracy or completeness. There is no guarantee that any forecasts made will come to pass. The views contained herein are as of the date noted on the material and are subject to change without notice; these views may differ from those of other T. Rowe Price group companies and/or associates. Under no circumstances should the material, in whole or in part, be copied or redistributed without consent from T. Rowe Price.
The material is not intended for use by persons in jurisdictions which prohibit or restrict the distribution of the material and in certain countries the material is provided upon specific request. It is not intended for distribution to retail investors in any jurisdiction.
July 2024 / MULTI-ASSET

Peter Stournaras is the head of the Integrated Equity Group in the Global Equity Division. He is a vice president of T. Rowe Price Group, Inc.

David Corris is a co-portfolio manager of the Integrated US Small-Mid Cap Core Equity, Integrated US Large-Cap Value Equity, Integrated US Small-Cap Growth Equity, and Integrated Global Equity Strategies in the U.S. Equity Division. In addition, he is a member of the Investment Advisory Committees of the US Large-Cap Value Equity, US Large-Cap Equity Income, and Global Value Equity Strategies. David is an executive vice president of the Integrated Equity Funds, Inc., and a vice president of the Equity Income Fund. He is a vice president of T. Rowe Price Group, Inc.

Brian Dausch is a portfolio specialist in the U.S. Equity Division. He is a member of the US Large-Cap Core Equity, US Mid-Cap Value Equity, US Small-Cap Growth Equity, Integrated Equity Suite, Health Sciences Equity, US and Global Real Estate Equity, Global Natural Resources Equity, and Global Real Assets Equity Strategy teams, working closely with institutional clients, consultants, and prospects. He is a vice president of T. Rowe Price Group, Inc.