
July 2024 / INVESTMENT INSIGHTS
Active investing is suited to the uncertain markets ahead
Changing market conditions will provide new risks and opportunities
Key Insights
- Passive investment strategies have enjoyed decades of growth, but there are signs that some of the drivers of this momentum are fading.
- The gap between active and passive fees is narrowing, while tax-efficient vehicles in the form of active exchange-traded funds are rapidly growing in popularity.
- We believe active managers with global scale and deep research platforms can thrive in the new world of higher rates, greater dispersion and heightened volatility.
Decades of growth in passive investing reached a milestone at the end of 2023 when U.S. passive mutual funds and exchange-traded funds (ETFs) held slightly more assets than active funds for the first time. Yet there are signs that some of the drivers of this momentum are fading as market and industry conditions change. The post-global financial crisis (GFC) era of low rates and abundant liquidity is being replaced by one of higher rates, greater divergence of returns, and more volatile markets—which is already providing the key ingredients for active investors to potentially outperform.
The rise of passive funds, which seek to mirror the performance of indices rather than beat them, has been nothing if not dramatic. Over the past 30 years, passive has grown from less than 5% of the U.S. equity and bond mutual fund and ETF markets to more than 50% (Fig. 1). The strong performance of passive funds in recent years has been a key factor in this increase. While active and passive strategies historically have traded periods of outperformance, passive performed particularly well in the very low interest rate environment that followed the GFC.
Passive market share has grown rapidly
(Fig. 1) Half the U.S. mutual fund and ETF market is now in passive strategies.
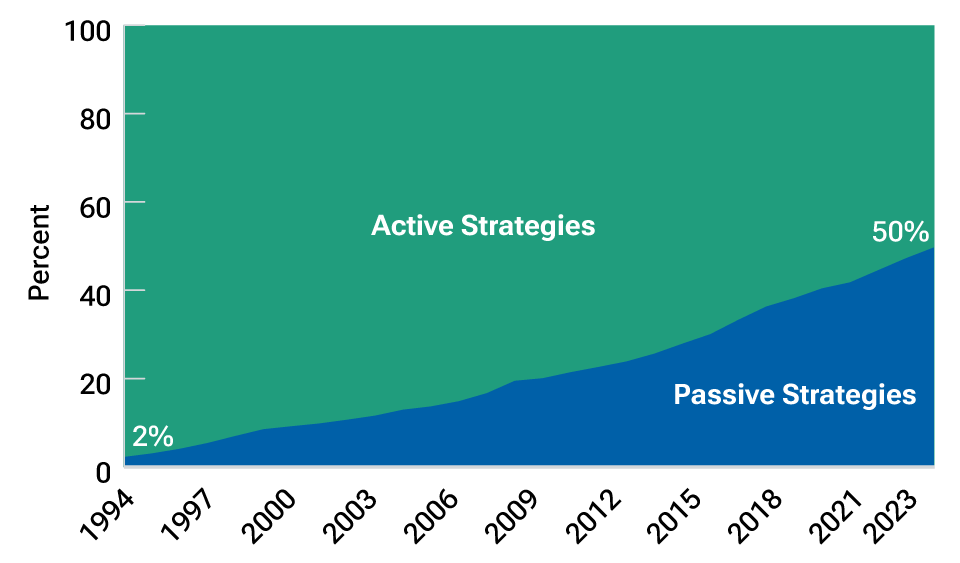
As of December 31, 2023.
Chart shows the percentage of U.S. mutual fund and ETF share of market in active and passive strategies.
Source: Morningstar (see Additional Disclosures).
After the onset of the crisis in 2008, central banks slashed worldwide policy rates—in some cases to 0%. Monetary policy was further loosened through quantitative easing—whereby central banks purchased securities from the open market to boost liquidity and encourage investment. This combination of very low rates and ample liquidity created the perfect conditions for equity markets to rise—from its post-GFC low point on March 9, 2009, to the end of June 2024, the S&P 500 Index delivered a cumulative price return of 707.1% and a cumulative total return (including dividends) of 987.4%.1
The huge momentum generated by accommodative monetary policy helped drive the growth of index funds, which have tended to outperform during periods of low volatility, strong U.S. stock market performance, and rising stock correlations. Cost considerations have also supported the growth of passive investing. The fees charged by passive equity funds historically have been cheaper than those of actively managed equity funds, while the tax‑efficient characteristics have further advantaged passively managed ETFs. However, the gap in fees has narrowed in recent years, complicating the perceived trade-off and lowering the hurdle for alpha, offsetting the fee differential.
The increase in indexing has also been noticeable in bond markets. However, the share of active in fixed income remains high and ahead of passive in many places. One reason for this is that it can be difficult to match the index in many fixed income strategies, leading to variations in performance between the fund and the index. Another is that the gap between passive and active fixed income fund fees is smaller.
Index concentration has posed a challenge for active investors
As stocks rose and passive strategies grew in the years following the GFC, another important development occurred: Indexes became more concentrated. The large gains in the U.S. stock market, in particular, were driven mainly by the extraordinary growth of a small number of tech stocks, which dominated cap-weighted indices (in which each stock is weighted according to its market capitalization). These dominant firms were collectively labeled the FANG (Facebook, Amazon, Netflix, and Google) in the early 2010s before Apple was added to form the FAANG in 2017. The FAANG was eventually replaced by the current dominant group, the so-called Magnificent Seven—Apple, Microsoft, Alphabet, Amazon, Meta Platforms, NVIDIA, and Tesla. The Magnificent Seven composed just over 32% of the S&P 500 at the end of June; a decade ago, the largest seven stocks in the S&P 500 composed 14% of the total index.
While active managers can excel during periods of concentrated equity markets, it becomes more difficult when the top performers are also the largest companies. In such environments, where a few major players drive most of the market’s gains, competition for capital within these large companies can significantly affect portfolio returns. Skilled active managers striving for diversification and prudent risk management are under pressure to allocate substantial capital to these dominant firms, thereby reducing their opportunity set. Although the current level of index concentration offers opportunities for active managers, it poses greater challenges compared with periods where managers were able to expand their opportunity sets.
While the extraordinary growth of the Magnificent Seven has boosted equity indices, it has also reduced the diversification benefits they can offer.2 Heavy index concentration can help to drive returns for passive investors when the dominant firms perform well, but it is likely to pose a significant challenge when those firms perform poorly. For indexers that seek to replicate the performance of the cap-weighted version of the S&P, for example, the dominance of the Magnificent Seven was not a problem last year as those stocks outperformed. However, if in the future smaller companies outperform larger ones, active investors with more diversified portfolios would be likely to perform better than those with portfolios with heavier allocations to large‑caps.
An inflection point in markets
Market concentration has risen sharply over the past decade (Fig 2), and markets are currently concentrated to a degree not seen in more than 50 years. History shows that the more skilled active managers typically have performed well coming out of concentrated markets. During the dot‑com bubble of the late 1990s, for example, the combined weight of the top 10 stocks in the S&P 500 peaked at 25%. In the aftermath of the bubble, index concentration fell sharply as tech companies plummeted in value. Active managers trailed indexers at the peak of the bubble in March 2002 but offered significant alpha (or excess returns) after it burst (Fig. 3).
Market concentration has soared over the past decade
(Fig. 2) The biggest firms are dominating major stock indices.
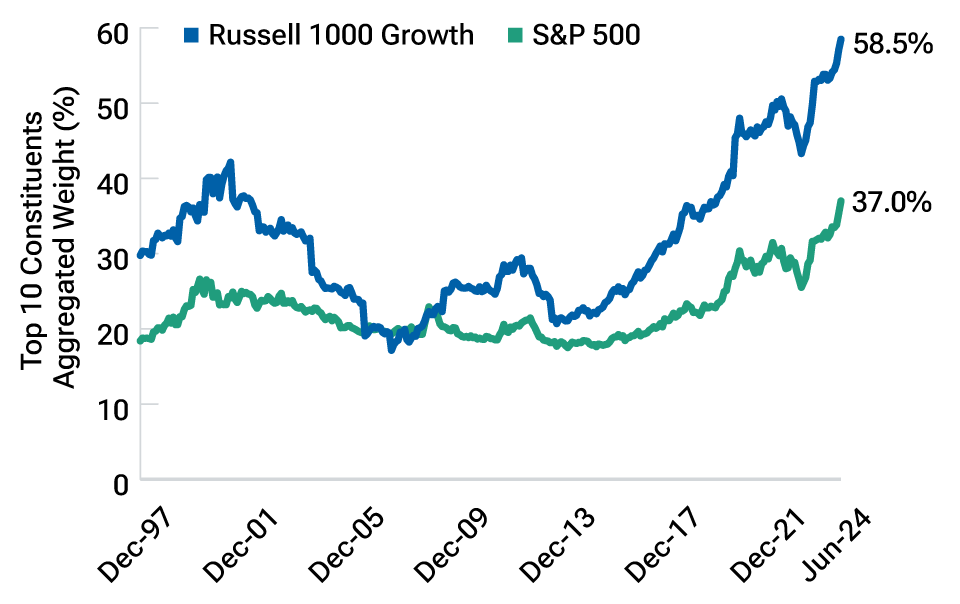
As of May 31, 2024.
Sources: FactSet. T. Rowe Price calculations using data from FactSet Research Systems Inc. All rights reserved. FTSE Russell and S&P (see Additional Disclosures).
Active managers provided significant alpha after tech bubble burst
(Fig. 3) Median excess returns were elevated.
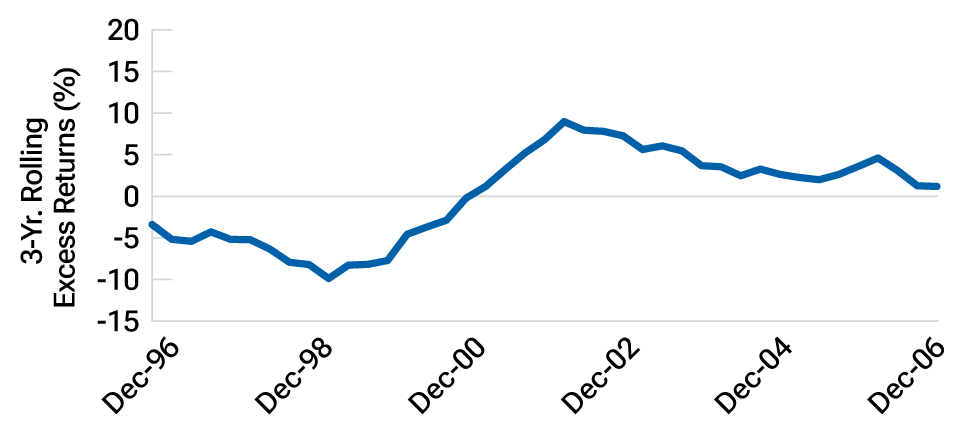
As of December 30, 2006.
Past performance is not a reliable indicator of future performance.
Chart shows median U.S. active manager three-year rolling excess returns net of fees, calculated monthly. The benchmark is the S&P 500 Index, which serves as the proxy for passive investing. The active manager group consists of all U.S. mutual funds that are classified as “U.S. Equity” according to Morningstar’s U.S. Category Group. Index funds are excluded. If a mutual fund had multiple share classes, the oldest share class was used as representative.
Sources: Morningstar and analysis by T. Rowe Price. See Additional Disclosures.
Similar patterns occurred in the Japan asset price bubble of the 1980s and the emerging markets rally of the 2000s. On both occasions, a surge in asset prices led to increasing index concentration before performance declined and dispersion returned. In both cases, flows surged into passive strategies as the bubble was forming, but the more skilled active managers outperformed after it burst.
Although it is difficult to predict when the current period of heavy index concentration is likely to recede meaningfully, it is clear we are going through an inflection point in markets. We appear to be moving from a world of benign disinflation to one of higher‑trend inflation, from a very low interest rate environment to a higher rate environment (Fig. 4), from a long period of low volatility to a period in which volatility is likely to be elevated, and from an era of elevated valuations in stocks and bonds to one closer to the historical norm.
Interest rates have spiked after declining for decades
(Fig. 4) Yields on U.S. bonds are at their highest since 2008.
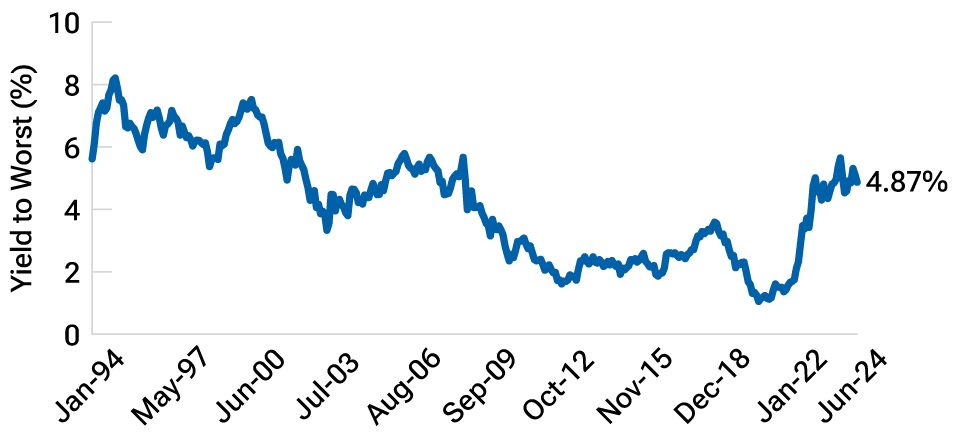
As of June 17, 2024.
Chart shows yield to worst of the Bloomberg U.S. Aggregate Bond Index.
Yield to worst is a measure of the lowest possible yield on a bond whose contract includes provisions that would allow the issuer to redeem the securities before they mature.
Source: Bloomberg Finance L.P.
Greater dispersion and volatility loom
This is a paradigm shift—and one that could have long-lasting implications. If a more discerning market does take hold, investors will likely need to be more valuation‑sensitive than in recent times, when a rising tide lifted all boats. We believe that fundamental research, and the ability to identify stock drivers and risk, will continue to be essential, but active managers who adopt a more dynamic approach should be better positioned to take account of wider macroeconomic, social, and geopolitical factors along with company fundamentals.
Active investors, by definition, tend to go beyond benchmarks and into factors that can be cyclical. For example, U.S.‑based active managers typically have outperformed when small-cap stocks performed well versus large caps, and when non‑U.S. stocks beat U.S. stocks.
Large-cap stocks have dominated for much of the past decade, but small-cap stocks are reasonably valued and consensus expectations are that they currently have stronger earnings growth prospects over the next few years—although U.S. small-cap stocks appear more vulnerable than those in Europe to rates remaining higher for longer. International stocks are currently reasonably valued and could thrive in a higher rate environment.
The end of the period of very low rates will also, I expect, lead to greater dispersion and heightened volatility in fixed income markets. Active management can help for duration3 management purposes, as well as for managing country selection, yield curve positioning, and security selection.
In addition to the impact of the new rate environment, the world is undergoing a revolutionary technology transition toward integrated artificial intelligence (AI). As in previous historic advances of this magnitude, this shift will likely widen the dispersion of company fundamentals. Active investors with the depth of research to discern the first‑ and second‑order beneficiaries of this process would have an advantage.
To be clear, the financial results of the Magnificent Seven have been extraordinary. Many of them have scale and dominant leads in large and rapidly growing markets. Regardless, history suggests that eventually competition, innovation, the law of large numbers, or government intervention will weigh on even the Magnificent Seven.
Conditions have shifted to favor active investing
Other, nonperformance-related factors behind the growth of passive funds may have also begun to fade. For example, while both active and passive funds have been subject to downward pressure on fees in recent years, the gap between them has narrowed (Fig. 5). Passive strategies now have little scope for further fee reductions.
The gap between passive and active fees has narrowed
(Fig. 5) Both have been subject to fee compression.
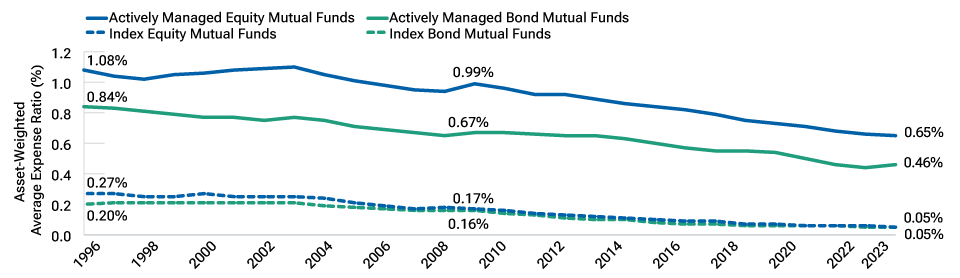
As of December 31, 2023.
Chart shows asset-weighted average expense ratio over time for groupings of active and passively managed equity and bond funds.
Sources: Investment Company Institute, Lipper, and Morningstar. Taken from “Trends in Expenses and Fees of Funds, 2023” by James Duvall and Alexander Johnson, 2024.
Tax-efficient vehicles, such as ETFs,4 have gained popularity. Historically, the ETF vehicle has been dominated by passive strategies. In recent years, there has been increasing choice for investors, with active ETF launches outpacing passive ETF launches (Fig. 6). While active ETFs are starting from a lower base, their growth has been outpacing passive ETFs.
Active ETFs have been growing faster than passive ETFs
(Fig. 6) Active ETFs grew at more than double the rate of passive ETFs in 2023.
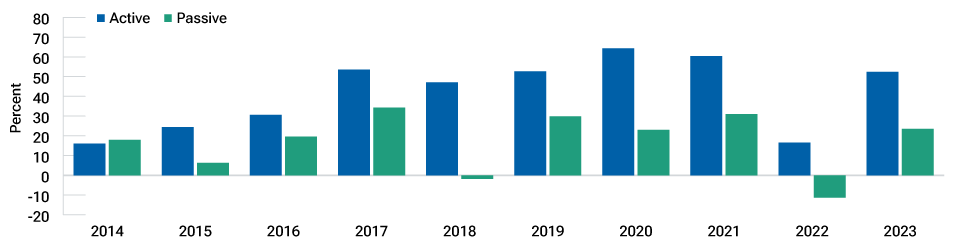
As of December 31, 2023.
Chart shows year-over-year assets under management growth rates of active and passive ETFs.
Source: Morningstar (see Additional Disclosures).
Combined with the likely performance-related changes described above, I believe these developments have fundamentally shifted the investment landscape in a way that will favor active investing—particularly active investment managers with global scale, deep research platforms, and a willingness to cast the net wide to identify the best outcomes for their clients. This does not mean I expect passive investing to undergo a major retreat. However, I do think that active management could be a better option for clients as we shift toward a market that has more tax‑efficient options in the form of active ETFs, that is priced more competitively than in the past overall, and that may offer better outcomes during periods of greater volatility and dispersion.
IMPORTANT INFORMATION
This material is being furnished for general informational and/or marketing purposes only. The material does not constitute or undertake to give advice of any nature, including fiduciary investment advice, nor is it intended to serve as the primary basis for an investment decision. Prospective investors are recommended to seek independent legal, financial and tax advice before making any investment decision. T. Rowe Price group of companies including T. Rowe Price Associates, Inc. and/or its affiliates receive revenue from T. Rowe Price investment products and services. Past performance is not a reliable indicator of future performance. The value of an investment and any income from it can go down as well as up. Investors may get back less than the amount invested.
The material does not constitute a distribution, an offer, an invitation, a personal or general recommendation or solicitation to sell or buy any securities in any jurisdiction or to conduct any particular investment activity. The material has not been reviewed by any regulatory authority in any jurisdiction.
Information and opinions presented have been obtained or derived from sources believed to be reliable and current; however, we cannot guarantee the sources’ accuracy or completeness. There is no guarantee that any forecasts made will come to pass. The views contained herein are as of the date noted on the material and are subject to change without notice; these views may differ from those of other T. Rowe Price group companies and/or associates. Under no circumstances should the material, in whole or in part, be copied or redistributed without consent from T. Rowe Price.
The material is not intended for use by persons in jurisdictions which prohibit or restrict the distribution of the material and in certain countries the material is provided upon specific request. It is not intended for distribution to retail investors in any jurisdiction.
July 2024 / ASSET ALLOCATION VIEWPOINT

Mr. Sharps has been a director of Price Group since January 2022. He is the chair of the board, chief executive officer, and president of T. Rowe Price Group, Inc. He also chairs the company's Executive, Management, and Management Compensation and Development Committees. Mr. Sharps has been with Price Group since 1997, beginning as an analyst specializing in financial services stocks, including banks, asset managers, and securities brokers, in the U.S. Equity Division. He was the lead portfolio manager of the Institutional Large-Cap Growth Equity Strategy from 2001 to 2016. In 2016, Mr. Sharps stepped down from portfolio management to assume an investment leadership position as co-head of Global Equity, at which time he joined the Management Committee. He was head of Investments and group chief investment officer from 2017 to 2021. In February 2021, Mr. Sharps became president of Price Group and then chief executive officer in January 2022. Prior to Price Group, he completed an internship as an equity research analyst at Wellington Management. Mr. Sharps also was employed by KPMG Peat Marwick as a senior management consultant, where he focused on corporate transactions, before leaving to pursue his M.B.A. in 1995.
