
July 2024 / INVESTMENT INSIGHTS
Special Topic: Can the Fed cut rates with financial conditions this loose?
The Fed appears ready to cut interest rates despite loose financial conditions
This Special Topic covers financial conditions, government debt, and recent economic history. It reads more like an op-ed than usual, but here are the investment conclusions:
Historically, loose financial conditions have favored risk-on tactical trades, such as stocks versus bonds, value versus growth, and high yield versus investment grade. My analysis supports the slightly risk-on stance. But the stock market has rallied so much that we may wait for pullbacks to increase our stocks versus bonds allocation.
This analysis also supports maintaining our Asset Allocation Committee’s trades designed to benefit from a broadening in the market—even if they have been painful so far this year.
Adding fuel to the fire?
Financial conditions (explained below) are now looser than they were before the Fed started hiking. They’re as loose as they were in 2021—when the liquidity party raged, and we saw rallies in non-fungible tokens (NFTs), nonprofitable tech companies, and meme stocks.
Spreads are tight, liquidity is abundant, and the stock market is making all-time highs.1 Meanwhile, unemployment remains near all-time lows. There are 8 million open jobs. And year to date, inflation is running at an annualized rate of 3.4%, which remains far above the Fed’s 2.0% target despite a soft May print.2
Yet the Fed wants to cut rates. Why? The Fed has never cut rates with conditions this loose.3
The official reasons are that unemployment has risen and inflation is coming down. So, if the Fed’s focus is on rates of change rather than levels, why not get ahead of the game and ensure a soft landing?
Does the Fed have other motives?
I believe there could be another reason staring us in the face. It’s something no one at the Fed talks about, yet it could be the main driver of the need to cut rates and further loosen financial conditions: The cost of paying the interest on U.S. government debt has exploded, as shown below.4 Debt levels are high, and so are interest rates. If you multiply the two, you get an interest expense that is about to rise to the second-biggest category of government spending after Social Security and ahead of defense and Medicare.
(Fig. 1) U.S. Treasury federal budget net outlays, net interest
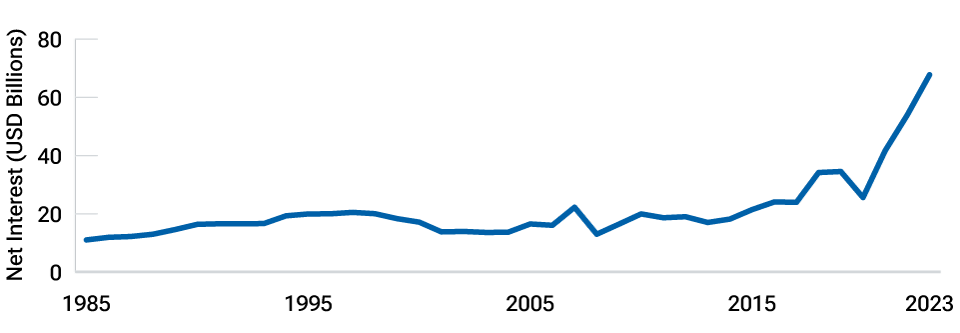
Source: Bloomberg L.P. Annual values as of June 21, 2024.
However, others on our research platform don’t agree that debt service is an important factor. “This is anathema to the Fed. Besides, interest expenditures as a percentage of total spending were higher in the 1980s and 1990s,” a colleague told me.
As we were having this debate, it occurred to me that I could crowdsource an opinion from LinkedIn. My typical follower is a savvy investment professional (or someone interested in the psychology of leadership—I cover both topics). It was a close vote:

Inflation shock: How did we get here?
Over the four decades preceding the coronavirus pandemic, there was no risk of an inflationary spiral. Technology and globalization kept a lid on inflation. From 2000 to 2020, prices for flat-screen TVs, computers, and other electronics dropped by over 60%.5 Prices for transportable goods like clothing, small household appliances, and toys also dropped significantly—thanks in large part to China. And in commodity markets, gains in productivity and the shale oil revolution boosted supply.
With no inflation risk in sight, every time we faced a growth shock, the Fed came to the rescue with rate cuts and asset purchases. To the extent there was inflation, it was in financial assets. Like a drug addict, the economy became dependent on stimulus. Every shock required a bigger dose to get the same buzz. The Fed’s balance sheet ballooned. The U.S.’s debt-to-gross domestic product ratio climbed higher, but rates declined, which kept debt service costs low.
Those were the days. The coronavirus pandemic changed the equation. We did what we had to do to prevent an economic depression. Central banks and governments deployed an unprecedented USD 20 trillion in global monetary and fiscal stimulus—a staggering amount, far surpassing anything we had ever seen, even in 2008–2009.6
Helicopter money
By printing money and essentially giving it away, we dropped money from the helicopter, as the saying goes. We went all in with zero rates, trillions in asset purchases, and unprecedented measures, such as generously enhanced unemployment benefits, loans to small businesses that could be forgiven, and over 400 million checks of USD 600 to USD 1,400 directly into people’s pockets.
We poured this stimulus on top of jammed supply chains, creating the ultimate recipe for inflation. Take that, secular disinflationary forces. Oh, and then Russia invaded Ukraine—a shock on a shock. The war resulted in disruptions to energy markets through sanctions, another round of shipping jams (in the Black Sea), and an agricultural commodity supply squeeze.
As we begin to recover from this inflation shock, it’s a surprise that 550 basis points (5.50 percentage points) in Fed hikes have had such limited negative economic effects. No economist I know of would have predicted that, at this stage, we would still be at 4.0% unemployment in the U.S. We had a liquidity party…but no hangover?
I’d argue that the economy has been resilient because the Fed was essentially trying to hold back a freight train:
- A massive amount of liquidity remains, including continued pedal-to-the-metal fiscal spending.
- Unlike prior economic cycles, household and corporate debt levels were low heading into the tightening.
- Households and corporations used zero rates during the pandemic to refinance and lock in low rates. (Raise your hand if your mortgage rate is below 4.5%.)
- Artificial intelligence has boosted capital spending and is starting to deliver on productivity gain promises, at least for those writing code (and for me, as I edit this article using Grammarly).
How do we define financial conditions?
There is no agreed-upon definition of financial conditions. Pundits, the financial press, and policymakers routinely mention financial conditions without defining the term.
The most common components of financial conditions are stock prices, the U.S. dollar, credit spreads, and interest rate levels.
Before we get into the nuances of the different indicators, why are financial conditions important to Fed decision-makers? There are three reasons:
1. PLUMBING: The Fed wants orderly markets. We all need the plumbing in financial markets to work smoothly, especially during crises. The Fed can’t let financial conditions deteriorate to an extreme that jeopardizes the entire system. In addition to the main variables listed above, financial conditions indicators produced by Bloomberg and the Chicago and Kansas City Feds incorporate several plumbing and liquidity measures, such as the TED spread (which measures the difference between the interest rate on short-term U.S. government debt and interbank loans), the Libor overnight index swap spread, the spread between on-the-run Treasuries (the newest issues) and off-the-run Treasuries (those trading on the secondary market), etc. By historical standards, these spreads are all flashing green.
2. DEMAND: Outside of systemic crises, financial conditions are the transmission mechanism between Fed policy and aggregate demand. Tighter financial conditions equal lower demand, and vice versa. Here’s the big picture of how financial conditions affect demand:

3. POLICY: Now, get ready for a circular reference. It’s understood, although not always admitted, that the Fed uses financial conditions as an input to its policy decisions. For example, historically, the Fed could be counted on to come to the rescue when stocks crashed. It’s what we call “the Fed put.”
Of course, economic growth is the confounding variable that affects both stock prices and Fed policy. The Fed watches markets, and markets watch the Fed. In other words, Fed policy is a function of financial conditions, and financial conditions are a function of Fed policy. Excel wouldn’t allow such a circular reference.
For our analysis, we used four financial conditions indexes (FCIs):
- Chicago Fed National FCI (CFed): 105 series from money, bond, and stock markets. Includes plumbing/liquidity data and is built based on a dynamic factor model.
- Kansas City Fed Financial Stress Index (KFed): This index extracts statistical factors from 11 variables using principal components analysis. It combines a variety of spreads (liquidity and credit) with measures of volatility and correlation across markets.
- Bloomberg FCI: 10 equally weighted variables across money, bond, and stock markets. Includes liquidity/plumbing and implied volatility indicators.
- Goldman Sachs FCI: Includes five series (fed funds rate, 10-year Treasury yield, BBB spread, S&P 500 Index, and the trade-weighted U.S. dollar index), weighted based on these variables’ impact on one-year changes in gross domestic product.
Note the differences in factors and methodologies. Some use volatility indicators, some don’t. KFed uses the idiosyncratic volatility of bank stock prices. The number of variables ranges from five to 105. The indexes include equal-weighted averages, a statistical macro model, and principal components. It’s all over the place. Yet the financial press refers to financial conditions as the most obvious, transparent, and easily measurable concept. Financial conditions are in the eye of the beholder!
The Bloomberg, KFed, and CFed are roughly 90% correlated with each other. The Goldman Sachs FCI differs from the other three (about 45% correlated) because it doesn’t include the financial plumbing spreads.7
Whatever the definition, financial conditions have generally tightened before prior recessions, and loose financial conditions have favored risk assets.
The thermometers below show that despite 550 basis points of Fed hikes, current financial conditions are loose.
However, the Fed’s new indicator, Financial Conditions Impulse on Growth (Fed FCI-G), differs. It shows tight financial conditions.8 Unlike the other indicators, this index includes fed funds and mortgage rates. Fed funds, as discussed, belie how loose conditions are. As do mortgage rates. The effective mortgage rate (what current mortgage holders are paying) is much lower than the quoted rate (7.32% quoted versus 3.78% effective).9 This is due to the debt maturity extensions when rates were low. A cynical analyst might surmise that the Fed has built this index to show tight conditions and, ipso facto, support rate cuts. But a committee member also offered this caveat: “If you’re a floating rate borrower, conditions aren’t loose.”
(Fig. 2) Percentiles of financial conditions based on their full history
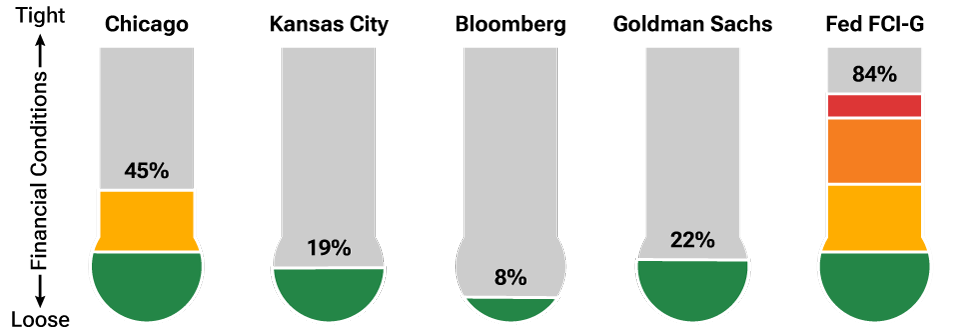
Sources: Goldman Sachs FCI and Bloomberg FCI indicators sourced from Bloomberg L.P. FCI-G, Kansas City Fed FCI, and Chicago Fed FCI are sourced from Macrobond. Using monthly data from February 1990 to May 2024. As of June 18, 2024.
The figure below shows the correlation between financial conditions and subsequent 12-month returns for tactical asset allocation positions when inflation was above 3%. We focus on these higher-inflation environments because, without inflationary pressure, there is no trade-off between Fed policy and growth. We report the average correlation across the five indicators and include levels and year-over-year changes. Hence, there are 5 x 2 = 10 predictors.
(Fig. 3) Average across 10 FCI variables, high-inflation regime only
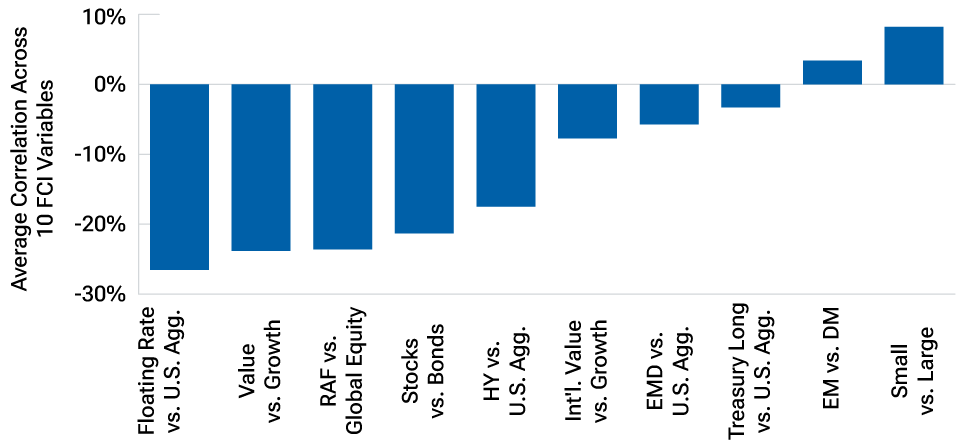
Sources: Goldman Sachs FCI and Bloomberg FCI indicators sourced from Bloomberg L.P. FCI-G, Kansas City Fed FCI, Chicago Fed FCI, and U.S. CPI are sourced from Macrobond. Using monthly data from February 1990 to May 2024. As of June 18, 2024.
Details: The 10 FCI Variables include 5 FCI levels and 5 year-over-year changes in these levels. High inflation regimes are defined as observations where there is a 1-year percentage change in the consumer price index above 3%. See Indices for additional details.
These predictors, in general, don’t work particularly well, and the results seem sensitive to the definition of financial conditions. This is not surprising because index returns are difficult to predict out of sample. Nonetheless, I believe the average correlation shows that loose financial conditions favor risk-on positions and value stocks (but not emerging market equities and small-caps, which have had secular challenges). (The correlations are negative because a high reading means tight conditions.)
One more uncertain factor to consider: If the Republicans prevail in the November elections, it will probably mean less regulation, including the potential for more mergers and acquisitions (M&A). In addition to the strong valuation case and potential macro catalysts such as rising oil prices, the Asset Allocation Committee (AAC) thinks more M&A would in turn favor value stocks, which would also likely benefit more from the extension of Trump era corporate tax cuts otherwise set to expire in 2025.
Regression analysis
Regression analysis helps us interpret these correlations in the context of current conditions. Let’s focus on stocks versus bonds.
When we apply the following regression, where financial conditions are measured as the average of the five indicators:
Stocks vs. bonds returns = alpha + beta (financial conditions)
The model suggests that, given current financial conditions, stocks could outperform bonds by 6.7% over the next 12 months, or 3.6% if we focus on high-inflation environments.
However, if we control for valuation, as follows, the results aren’t as supportive of risk assets:
Stocks vs. bonds returns = alpha + beta1 (financial conditions) + beta2 (earnings yield)
This version of the model now suggests that stocks could outperform bonds by 3.7% or underperform by -4.8% if we focus on high-inflation environments.10
Takeaways
Financial conditions are loose and could get looser when the Fed cuts rates. By historical standards, this environment should be favorable for risk assets and market broadening. However, high valuations could negate the tailwind from financial conditions. Investors may want to wait for valuations to come down before adding to risk assets. For now, the AAC remains fully invested at a risk level that’s only slightly above our long-term strategic asset allocation.
Thank you to Gio Steckel for running the numbers and to Rob Panariello and Charles Shriver for their valuable contributions.
Actual outcomes may differ materially from estimates and probabilities provided in this Insights. Altering data inputs of the analysis shown in this Insights could yield different results. It is not possible to invest directly in an index.
A credit spread is the difference in yield between two debt securities of the same maturity, that do not have the same credit quality.
Earnings yield (E/P) is the earnings per share (E) divided by the market price (P) of each share.
Regression models describe the relationship between measurable variables. At a basic level, a regression model allows for estimating how one variable may react or change as another independent variable changes. The models can also help identify if there’s a strong or weak relationship between the two.
Indices
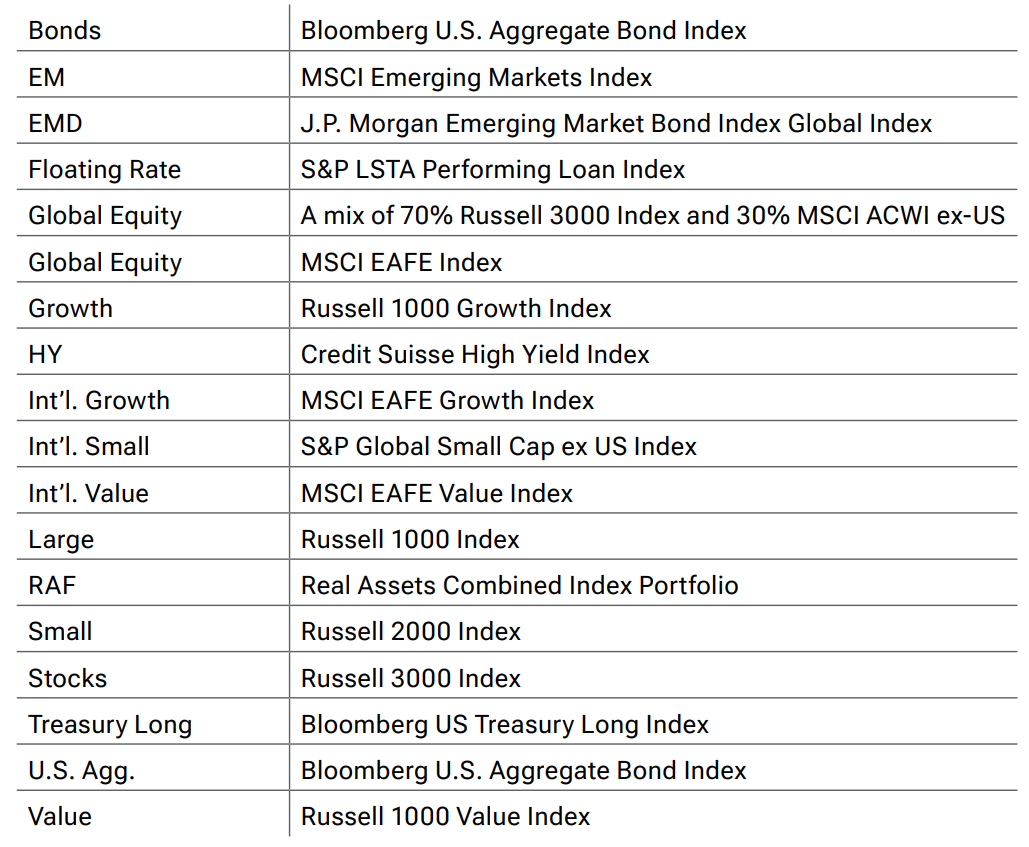
Forward returns are the 12-month returns calculated from the annual returns of the index. Each of the values for the above forward returns is the difference in annual return between the two indices. In Figure 3, the asset allocation decisions refer to the indices as follows:
As of May 1, 2022, the Real Assets Combined Index Portfolio is composed of 30%
MSCI World Select Natural Resources Net, 25% MSCI ACWI Metals and Mining Net,
20% FTSE NAREIT All Equity REITs Index, 20% EPRA/NAREIT Developed Real Estate
Index Net, 4% MSCI ACI IMI Gold Net, and 1% ACWI IMI Precious Metals Net. Prior
to this date, the Real Assets Combined Index Portfolio was composed of 30% MSCI
World Select Natural Resources Net, 25% MSCI ACWI Metals and Mining Net, 20%
Wilshire RESI, 20% EPRA/NAREIT Dev Real Estate Index Net, 4% MSCI ACI IMI Gold
Net, and 1% ACWI IMI Precious Metals Net. Prior to January 1, 2018, the Real
Assets Combined Index Portfolio was composed of 25% MSCI ACWI Metals and Mining Net, 20% Wilshire RESI, 20% FTSE EPRA/NAREIT Dev Real Estate Index Net, 19.5% MSCI ACWI Energy Net, 10.5% MSCI ACWI Materials Net, 4% MSCI ACWI IMI Gold Net, 1.00% MSCI ACWI IMI Precious Metals and Minerals Net. Prior to December 1, 2013, the Real Assets Combined Index Portfolio was composed of 25% MSCI ACWI Metals and Mining Net, 20% Wilshire RESI, 20% FTSE EPRA/NAREIT Developed Real Estate Index Net, 16.25% MSCI ACWI Energy Net, 8.75% MSCI ACWI Materials Net, 5% UBS World Infrastructure and Utilities Index, 4% MSCI ACWI IMI Gold Net, and 1% MSCI ACWI IMI Precious Metals and Minerals Net.
IMPORTANT INFORMATION
This material is being furnished for general informational and/or marketing purposes only. The material does not constitute or undertake to give advice of any nature, including fiduciary investment advice, nor is it intended to serve as the primary basis for an investment decision. Prospective investors are recommended to seek independent legal, financial and tax advice before making any investment decision. T. Rowe Price group of companies including T. Rowe Price Associates, Inc. and/or its affiliates receive revenue from T. Rowe Price investment products and services. Past performance is not a reliable indicator of future performance. The value of an investment and any income from it can go down as well as up. Investors may get back less than the amount invested.
The material does not constitute a distribution, an offer, an invitation, a personal or general recommendation or solicitation to sell or buy any securities in any jurisdiction or to conduct any particular investment activity. The material has not been reviewed by any regulatory authority in any jurisdiction.
Information and opinions presented have been obtained or derived from sources believed to be reliable and current; however, we cannot guarantee the sources' accuracy or completeness. There is no guarantee that any forecasts made will come to pass. The views contained herein are as of the date noted on the material and are subject to change without notice; these views may differ from those of other T. Rowe Price group companies and/or associates. Under no circumstances should the material, in whole or in part, be copied or redistributed without consent from T. Rowe Price.
The material is not intended for use by persons in jurisdictions which prohibit or restrict the distribution of the material and in certain countries the material is provided upon specific request.
It is not intended for distribution to retail investors in any jurisdiction.

Sébastien Page is head of Global Multi-Asset and chief investment officer. He is a member of the Asset Allocation Committee, which is responsible for tactical investment decisions across asset allocation portfolios. Sébastien also is a member of the Management Committee of T. Rowe Price Group, Inc.