
June 2024 / INVESTMENT INSIGHTS
How an investment strategy can blend the best of active and passive
A research-enhanced strategy can help clients get more from their portfolio’s core
Key Insights
- Clients worried about overly relying on the market’s continued strength may want to consider a strategy that aims to blend the best of active and passive investing.
- A strategy that seeks a market‑plus return with market‑like risk could add value as an alternative or as a complement to typical passive or active solutions.
- An analyst‑driven approach, when it’s well executed, has the potential to generate strong, risk‑efficient returns through the market’s ups and downs.
The appeal of passive investment strategies offering exposure to broad equity indexes is easy to understand. Low fees and a strong stock market have made for a compelling proposition.
For clients concerned about relying too much on the broader market’s continued strength to meet their longer‑term objectives, a middle path that combines the advantages of active and passive could be appealing.
Seeking the best of both worlds
Passive investment strategies that track indexes such as the S&P 500 or the MSCI All Country World are common portfolio building blocks.
The popular core/satellite approach typically uses the market‑like returns that these passive solutions offer to balance other investments that take more active risk in the pursuit of stronger outperformance.
Shifting to traditional actively managed strategies isn’t necessarily an option for clients seeking to diversify their portfolio’s core. That’s especially true if they have a strict risk budget.
- By design, active strategies tend to exhibit higher levels of tracking error, or variability in their performance relative to the benchmark.
- Strategies with higher tracking error can outperform, but the dispersion in results historically has been wider in this group (Figure 1). Picking the right manager is critical.
- Capacity constraints may also prevent pension funds and other large investors from allocating as much capital as they might like to traditional actively managed strategies. These solutions are often less diversified and may have larger allocations to small-cap stocks and off-benchmark securities.
Wider dispersion in outcomes for U.S. large-cap equity strategies with higher tracking error
(Fig. 1) Average annualized excess returns, after fees, and tracking error vs. the S&P 500 Index
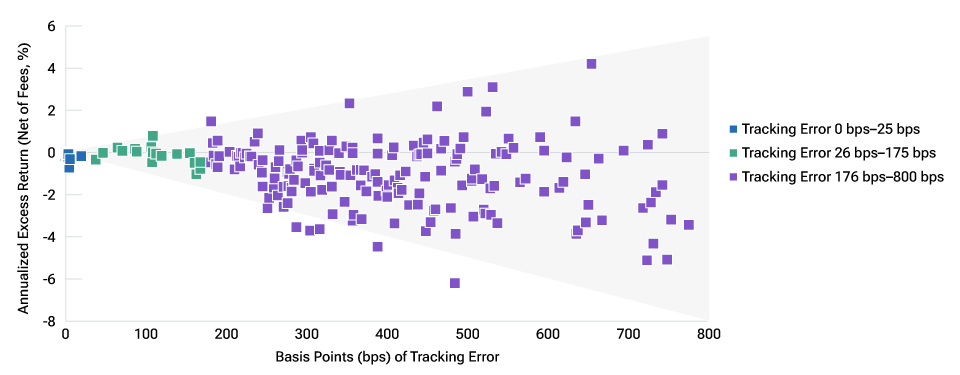
March 31, 2014, to March 31, 2024.
Past performance is not a reliable indicator of future performance.
See the Performance section for the 1-, 5-, 10-, and 15-year annualized, net of fees returns for the US Structured Research Equity Composite as of March 31, 2024.
Source: eVestment Alliance, LLC. Data analysis by T. Rowe Price. See Additional Disclosures.
Index performance is for illustrative purposes only and is not indicative of any specific investment. Investors cannot invest directly in an index.
The exhibit comprises U.S. large‑cap equity strategies that had at least USD 250 million in assets under management as of March 31, 2024, and use the S&P 500 Index as their primary benchmark. The eVestment categories that define this universe are Large Cap, Passive US Equity S&P 500 Index, and Enhanced Large Equity S&P 500. The exhibit omits a small number of outlier data points with tracking errors higher than the top range. Here, tracking error measures, in basis points, the volatility in a strategy’s returns relative to its benchmark, the S&P 500. One basis point is 0.01 percentage point. Strategies with higher levels of tracking error have exhibited higher levels of variability in their performance relative to the benchmark; strategies with lower levels of tracking error have exhibited less divergence in performance versus the benchmark. Excess return is the difference between a strategy’s total return and the total return generated by the S&P 500 Index (including gross dividends reinvested). The strategies’ returns shown are net of fees. They reflect the deduction of the highest applicable management fee that would be charged based on the fee schedule contained within this material, without the benefit of breakpoints. Please see the GIPS® Composite Report for additional information on the composite.
An active‑enhanced index strategy could add meaningful value as an alternative or as a complement to typical passive or active solutions.
The value proposition is simple: the prospect of a market‑plus return with market‑like risk. However, consistently delivering on these goals has been difficult for the asset management industry.
We believe that an analyst‑driven strategy, when it’s thoughtfully designed and well executed, has the potential to generate strong, risk‑efficient returns through the market’s ups and downs.
Fundamental research as a source of potential edge
The design and implementation of active‑enhanced index strategies vary. Some rely on risk controls and stock picking. Others look to enhance returns through derivatives or by bundling fixed income strategies on top of exposure to the broader equity market.
Regardless of the approach, two principles are usually in play:
- Identifying a source of edge that creates the potential for excess returns across different market environments; and
- Isolating this competitive advantage by implementing strict portfolio construction rules that aim to approximate the risk exposures of the broader market.
Of course, markets are dynamic and highly competitive. Many sources of investment edge erode, unless they, too, change and adjust.
The potential advantages that come from rigorous fundamental research could be more durable because analysts focus on how a company’s prospects and risk/reward profile may evolve over time.
For this reason, a risk‑controlled strategy that seeks to isolate the power of individual analysts’ stock‑picking skills may have the ability to outperform in a variety of environments.
A large active manager may have a leg up because it can support a global team of experienced research analysts to offer both breadth of coverage and depth of knowledge.
With the resources to pursue their curiosity and creativity, these experts should be well positioned to develop differentiated investment insights.
Building an analyst‑driven strategy in pursuit of risk‑efficient returns
How can a strategy offer the potential benefits of active stock picking while maintaining a similar look and feel to a popular market index?
Here is how we've designed our suite of structured research equity solutions.
1. Analyst‑driven stock picking: Capital is spread across an extensive team of seasoned analysts. Each receives an allocation in proportion to the weighting of his or her coverage universe in the benchmark. They do not need to own every company in the index. Instead, each analyst seeks to allocate more capital to the stocks whose business fundamentals look attractive and to underweight or avoid names whose prospects appear less favorable. The portfolio also has the flexibility to hold a small proportion of stocks outside the index.
2. Risk controls: Deviations from the benchmark are governed by strict constraints on active weightings at the sector, industry, and holding levels. An oversight team tracks a battery of factor exposures—for example, momentum, business quality, growth, or value—and works with the analysts to rebalance the portfolio regularly. These efforts seek to ensure that the strategy isn’t taking any unforeseen risks relative to its benchmark.
Taking a multi‑contributor approach captures a diversity of viewpoints and investing styles while limiting the key‑man risk associated with single‑manager strategies. Relying on analysts to select stocks in the sectors and industries they know so well also provides a layer of risk management.
When implemented effectively, this process should result in a risk-controlled portfolio that creates a stage for the analysts’ stock selections to drive relative performance.
Combining the advantages of active and passive investing
Popular indexes such as the S&P 500 and the MSCI All Country World were created to measure the performance of the broader market. Despite their strong performance over the past 10 years, they were not designed as investment portfolios.
Putting seasoned analysts directly in charge of stock selection for their area of expertise offers exposure to the potentially return‑enhancing benefits of active management:
- Exploiting dislocations: Whether it’s a possible peak or trough in the market, a sector, or a stock, a deep understanding of individual companies and their growth prospects can give analysts the courage of conviction to trim or add to a position when uncertainty is high.
- Taking advantage of heightened dispersion: Focusing on fundamentals can also help when the differences in stock performance are especially high in a sector or industry. Consider, for example, the divergence in returns generated by companies that are perceived as benefiting from investments in advanced artificial intelligence.
- Looking forward, not backward: Analysts may be able to start a position before the company joins the benchmark or avoid names that are at risk of being removed. In these instances, the resulting investment inflows or outflows may boost or inhibit a stock’s near‑term performance.
At the same time, appropriate controls mean that an actively managed strategy that’s designed in this way can offer a similar risk profile to passive portfolios that track a broader market index:
- Diversification across sectors, industries, and individual companies is part of the appeal and can help to offer significant capacity for institutional clients.
- Market‑like regional and sector weights, as well as factor exposures such as momentum or style (growth versus value), can help to blunt the risk posed by sharp shifts in market leadership.
- This approach should yield a neutral portfolio that doesn’t rely on a particular subsection of the market to generate excess returns. In other words, the potential for outperformance is spread across a diversity of sectors, industries, and individual companies.
These qualities may strike clients as compelling after the roller coaster ride of the past several years and the extraordinarily narrow market of 2023, when a handful of mega‑caps drove the bulk of the upside.
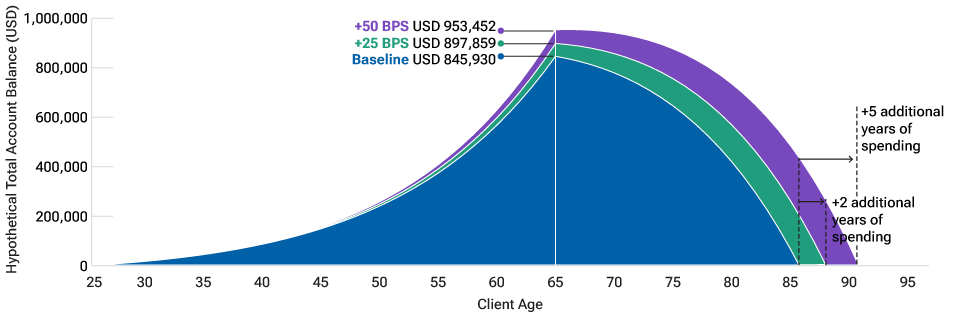
The power of potential compounding
Aiming to approximate the risk characteristics of an index might limit the magnitude of a strategy’s potential excess returns over shorter time frames. However, these controls also reduce the risk that it will underperform the benchmark by a wide margin.
This steadiness and the potential for analyst‑driven stock selection to add value mean that, if well executed, this risk‑efficient approach may be able to compound at a compelling rate over longer time frames. The key is the frequency of outperformance over time (Figure 2).
Bottom line: An analyst‑driven strategy that combines the best of active and passive investing has the potential to make a real difference for clients over the long term. Evaluating the people and process is critical to identifying strategies with the potential to deliver above‑market returns with market‑like risk.
Strong relative returns in up and down markets
(Fig. 2) US Structured Research Equity Composite, excess returns vs. the S&P 500 Index
May 31, 1999,1 to March 31, 2024.
Past performance is not a reliable indicator of future performance.
See the Performance section for the 1‑, 5‑, 10‑, and 15‑year annualized, net of fees returns for the US Structured Research Equity Composite as of March 31, 2024.
Index performance is for illustrative purposes only and is not indicative of any specific investment. Investors cannot invest directly in an index.
Up or down market is based on the absolute returns of the S&P 500 Index. An up market is a 12-month period where the S&P 500 generated a positive return. A down market is a 12-month period where the S&P 500 posted a negative return. Excess returns are the net of fees total returns (including reinvested dividends) for the US Structured Research Equity Composite minus the total returns (including gross dividends) for the S&P 500 Index. Net-of-fee performance reflects the deduction of the highest applicable management fee that would be charged based on the fee schedule contained within this material, without the benefit of breakpoints. Excess returns were calculated over 12‑month periods, rolled monthly. Up and down market hit rates reflect the percentage of rolling 12‑month periods in which the US Structured Research Equity Composite generated a positive excess return.
See the Additional Disclosures page for additional legal notices and disclaimers.
1May 31, 1999, represents the date that the US Structured Research Equity Strategy’s investment mandate changed to the current analyst‑driven strategy. Please see the GIPS® Composite Report for additional information on the composite.
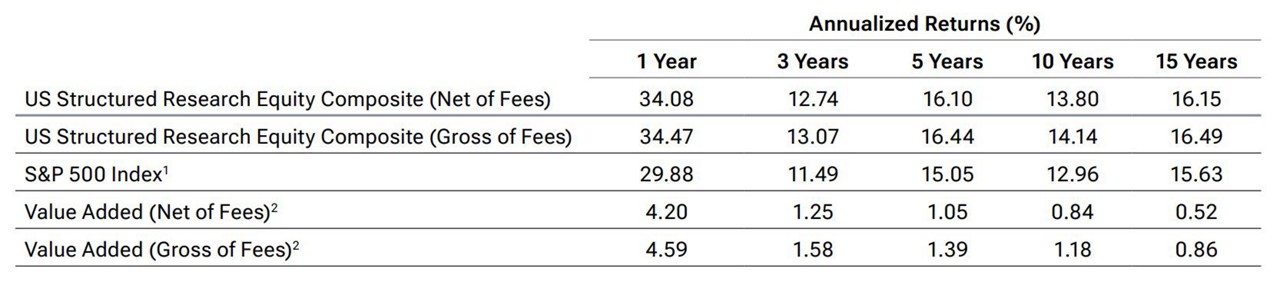
Performance: US Structured Research Equity Composite
As of March 31, 2024. All calculations in U.S. dollars.
Past performance is not a reliable indicator of future performance.
Gross performance returns are presented before management and all other fees, where applicable, but after trading expenses. Net-of-fee performance reflects the deduction of the highest applicable management fee that would be charged based on the fee schedule contained within this material, without the benefit of breakpoints. Gross and net performance returns reflect the reinvestment of dividends and are net of all non‑reclaimable withholding taxes on dividends, interest income, and capital gains.
1S&P 500 Index returns shown with gross dividends reinvested. Please see the Additional Disclosures page for additional legal notices and disclaimers.
2The Value Added rows are shown as US Structured Research Equity Composite minus the benchmark.
GIPS® Composite Report
US Structured Research Equity Composite
Period Ended December 31, 2023
Figures Shown in U.S. dollar
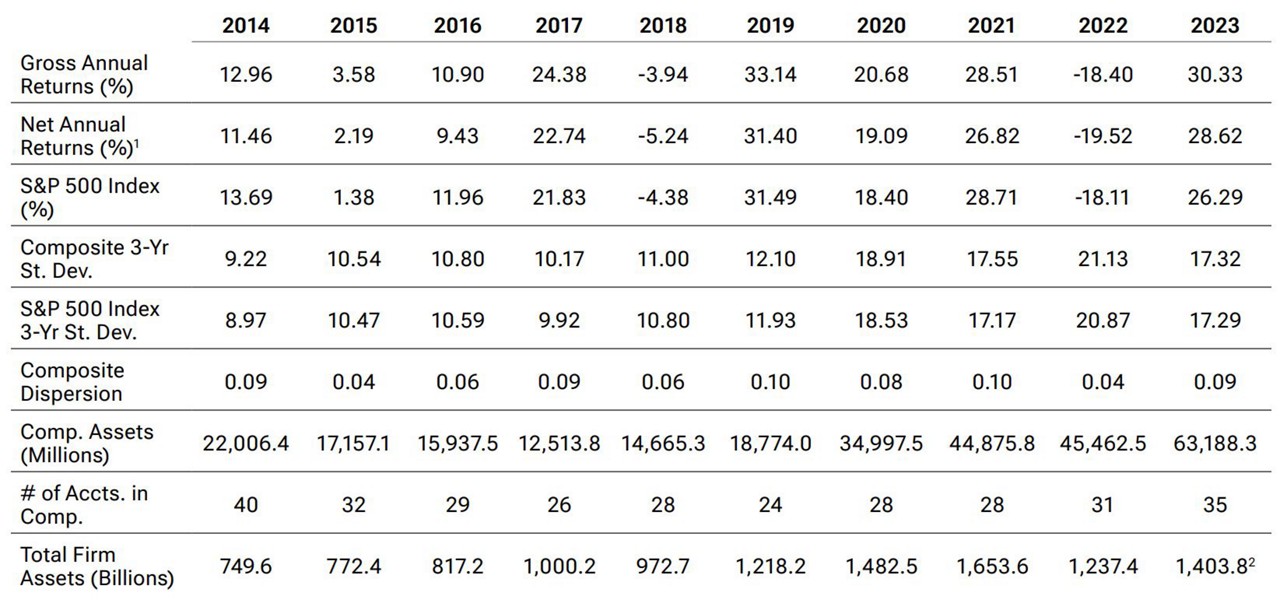
1 The fee rate used to calculate net returns is 1.35%. This represents the maximum fee rate applicable to all composite members. Past performance is not a reliable indicator of future performance.
2Preliminary—subject to adjustment.
T. Rowe Price (TRP) claims compliance with the Global Investment Performance Standards (GIPS®) and has prepared and presented this report in compliance with the GIPS standards. TRP has been independently verified for the 27‑year period ended June 30, 2023 by KPMG LLP. The verification report is available upon request. A firm that claims compliance with the GIPS standards must establish policies and procedures for complying with all the applicable requirements of the GIPS standards. Verification provides assurance on whether the firm’s policies and procedures related to composite and pooled fund maintenance, as well as the calculation, presentation, and distribution of performance, have been designed in compliance with the GIPS standards and have been implemented on a firm wide basis. Verification does not ensure the accuracy of any specific composite presentation. TRP is a U.S. investment management firm with various investment advisers registered with the U.S. Securities and Exchange Commission, the U.K. Financial Conduct Authority, and other regulatory bodies in various countries and holds itself out as such to potential clients for GIPS purposes. TRP further defines itself under GIPS as a discretionary investment manager providing services primarily to institutional clients with regard to various mandates, which include U.S., international, and global strategies but excluding the services of the Private Asset Management group. As of October 1, 2022, there is no minimum asset level for portfolio inclusion into the composite. Prior to October 2022, the minimum asset level for equity portfolios to be included in composites was $5 million. The minimum asset level for fixed income and asset allocation portfolios to be included in composites was $10 million. Valuations are computed and performance reported in U.S. dollars.
Gross performance returns are presented before management fees and all other fees, where applicable, but after trading expenses. Net of fees performance reflects the deduction of the maximum fee rate applicable to all composite members as shown above. Gross performance returns are presented gross of withholding taxes on dividends, interest income, and capital gains. Please be advised if a client is subject to withholding taxes the actual performance of all other portfolios in the composite subject to withholding may be lower than the composite returns presented gross of withholding taxes. Gross performance returns are used to calculate presented risk measures. Effective June 30, 2013, portfolio valuation and assets under management are calculated based on the closing price of the security in its respective market. Previously portfolios holding international securities may have been adjusted for after‑market events. Policies for valuing portfolios, calculating performance, and preparing compliant presentations are available upon request. Dispersion is measured by the standard deviation across asset‑weighted portfolio returns represented within a composite for the full year. Dispersion is not calculated for composites in which there are five or fewer portfolios.
Some portfolios may trade futures, options, and other potentially high-risk derivatives that may create leverage and generally represent in aggregate less than 10% of a portfolio.
Benchmarks are taken from published sources and may have different calculation methodologies, pricing times, and foreign exchange sources from the composite.
Composite policy requires the temporary removal of any portfolio incurring a client initiated significant cash inflow or outflow greater than or equal to 10% of portfolio assets. The temporary removal of such an account occurs at the beginning of the measurement period in which the significant cash flow occurs and the account re‑enters the composite on the last day of the current month after the cash flow. Additional information regarding the treatment of significant cash flows is available upon request.
The firm's list of composite descriptions, a list of limited distribution pooled fund descriptions, and a list of broad distribution pooled funds are available upon request. GIPS® is a registered trademark of CFA Institute. CFA Institute does not endorse or promote this organization, nor does it warrant the accuracy or quality of the content contained herein.
Fee Schedule

1A transitional credit is applied to the fee schedule as assets approach or fall below the breakpoints. Extended breakpoints may be available for higher asset levels. Minimum separate account size 50 million USD.
Additional Disclosures
The S&P 500 is a product of S&P Dow Jones Indices LLC, a division of S&P Global, or its affiliates (“SPDJI”) and has been licensed for use by T. Rowe Price. Standard & Poor’s® and S&P® are registered trademarks of Standard & Poor’s Financial Services LLC, a division of S&P Global (“S&P”); Dow Jones® is a registered trademark of Dow Jones Trademark Holdings LLC (“Dow Jones”). T. Rowe Price is not sponsored, endorsed, sold or promoted by SPDJI, Dow Jones, S&P, their respective affiliates, and none of such parties make any representation regarding the advisability of investing in such product(s) nor do they have any liability for any errors, omissions, or interruptions of the S&P 500.
Source for eVestment data: ©2024 eVestment. All rights reserved. The information contained herein: (1) is proprietary to eVestment and/or its content providers; (2) may not be copied or distributed; and (3) is not warranted to be accurate, complete, or timely. Neither eVestment nor its content providers are responsible for any damages or losses arising from any use of this information. Past performance is no guarantee of future results.
IMPORTANT INFORMATION
This material is being furnished for general informational and/or marketing purposes only. The material does not constitute or undertake to give advice of any nature, including fiduciary investment advice, nor is it intended to serve as the primary basis for an investment decision. Prospective investors are recommended to seek independent legal, financial and tax advice before making any investment decision. T. Rowe Price group of companies including T. Rowe Price Associates, Inc. and/or its affiliates receive revenue from T. Rowe Price investment products and services. Past performance is not a reliable indicator of future performance. The value of an investment and any income from it can go down as well as up. Investors may get back less than the amount invested.
The material does not constitute a distribution, an offer, an invitation, a personal or general recommendation or solicitation to sell or buy any securities in any jurisdiction or to conduct any particular investment activity. The material has not been reviewed by any regulatory authority in any jurisdiction.
Information and opinions presented have been obtained or derived from sources believed to be reliable and current; however, we cannot guarantee the sources' accuracy or completeness. There is no guarantee that any forecasts made will come to pass. The views contained herein are as of the date noted on the material and are subject to change without notice; these views may differ from those of other T. Rowe Price group companies and/or associates. Under no circumstances should the material, in whole or in part, be copied or redistributed without consent from T. Rowe Price.
The material is not intended for use by persons in jurisdictions which prohibit or restrict the distribution of the material and in certain countries the material is provided upon specific request.
It is not intended for distribution to retail investors in any jurisdiction.
June 2024 / INVESTMENT INSIGHTS

Tamzin Manning is a portfolio specialist in the Investment Specialist Group within the U.S. Equity Division. She provides North American support for the US Structured Research Equity, US Dividend Growth Equity, and Impact Equity Strategies. Tamzin is a vice president of T. Rowe Price Associates, Inc.

